BTCUSD: Trade Setup for this week


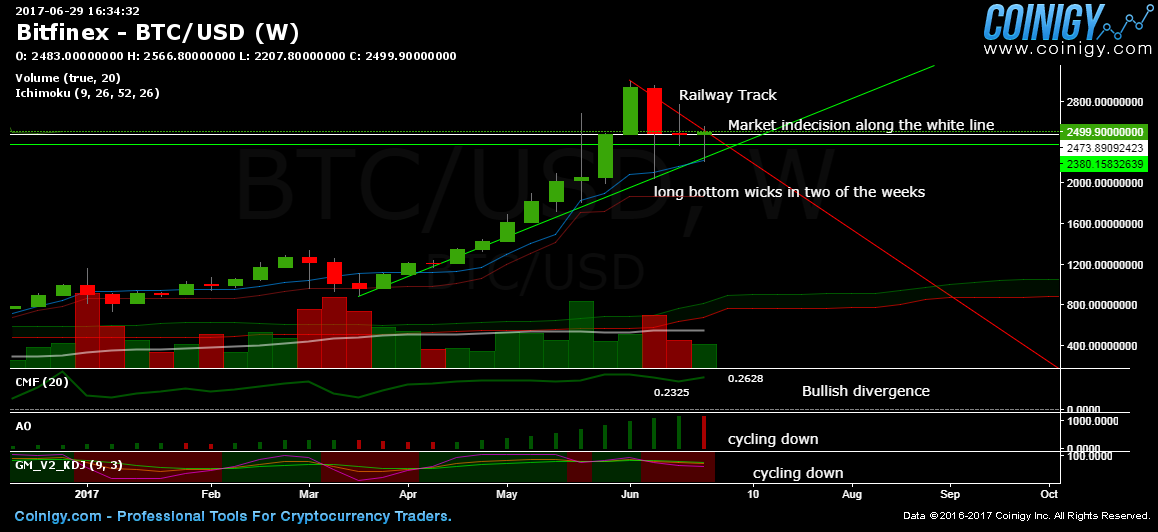
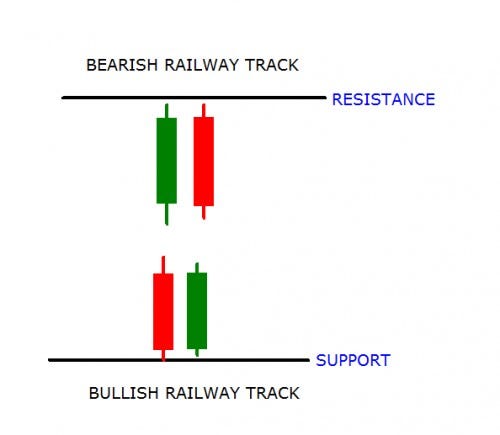
Bearish: The railway track pattern is only applicable when you are in a trend as it is considered a reversal pattern. Since it happen on a weekly chart, it is a strong signal for reversal.
Bullish: However, there are extended wicks, those that are longer relative to other wicks on the chart, provide valuable information for the trader.
A long wick at the bottom of the candle signifies that sellers were able to push the price down significantlyand that is what creates the long wick.
However, the seller’s numbers were not great enough to keep the price at that low level. The buyers were able to push price back up from that low level thereby showing strength. Since the buyers triumphed in that sense, there exists the potential that their strength will carry forward and given that strength the price may rise.
Bullish: The Chaikin Money Flow (CMF) shows there is growing inflow of money from 0.2325 to 0.2628. This maybe another hidden bullish divergence which might signal the continuation of the rally.
Bearish: The other two indicators, Awesome Oscillator and KDJ Indicator, shows the week is cycling downwards which means there is supposed to be less buyer strength and more seller strength. However, it doesn’t necessarily mean the price will go lower. In some situations, the price could even climb higher.
Conclusion: Slightly bullish
How to trade this:

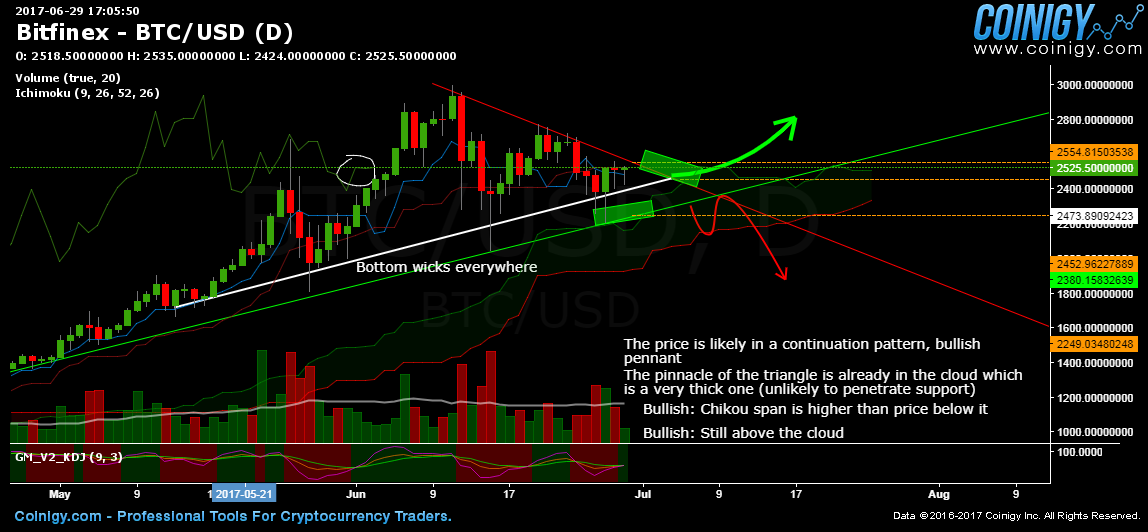
First setup (first green box): Go long position along the bottom of the triangle and top of the cloud of support. In case of failure, you can exit position with slight profit because you got in early before the triangle’s pinnacle or at breakeven at the pullback if the dump is fast.
Second setup (second green box): Go long at the triangle’s breakout. This is much safer and it confirms the continuation of the rally. However there is a slight risk of a fakeout and then it dumps to your margin call.
Best to chart your positions using this fine charting tool. It also charts all sorts of altcoins.
Best place to margin trade bitcoin is here.


