Bitcoin Daily BTCUSD Trade Setup for July 4 - 5


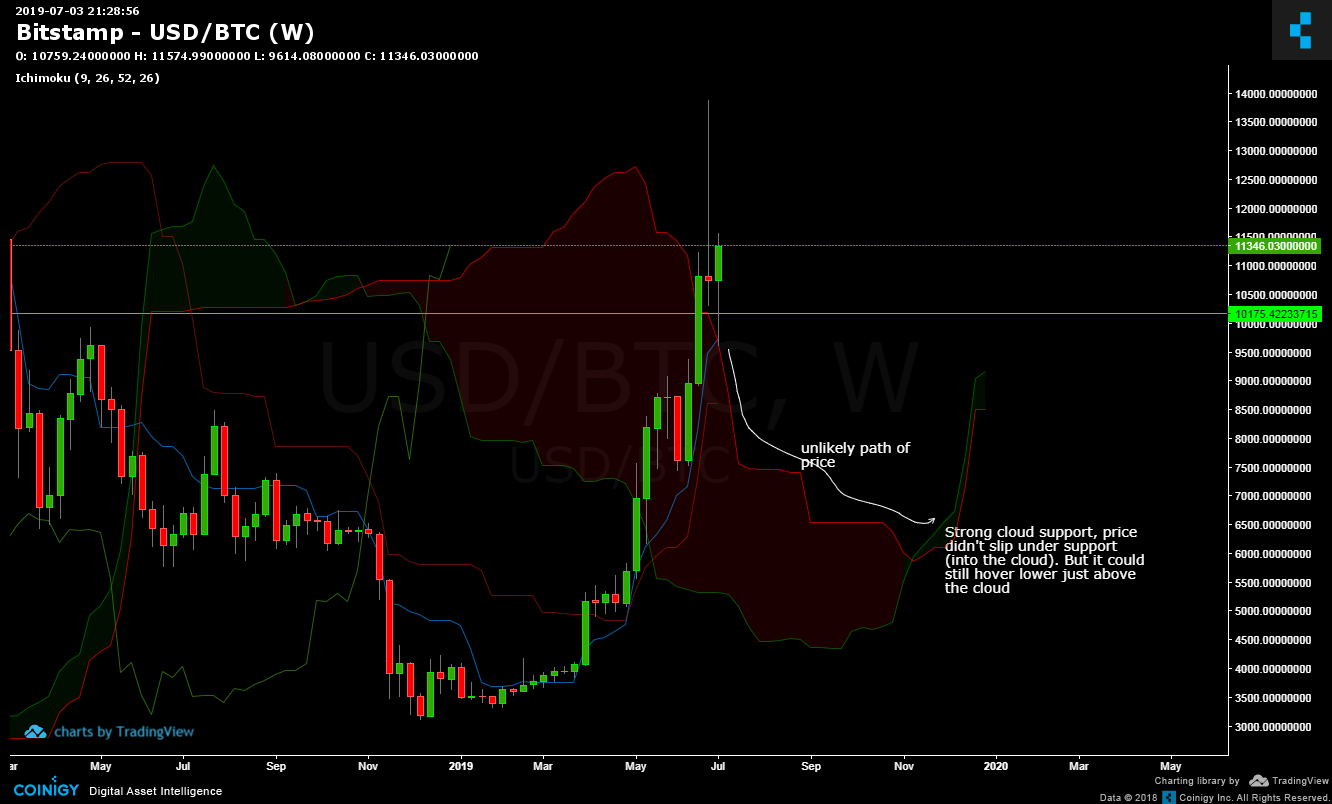
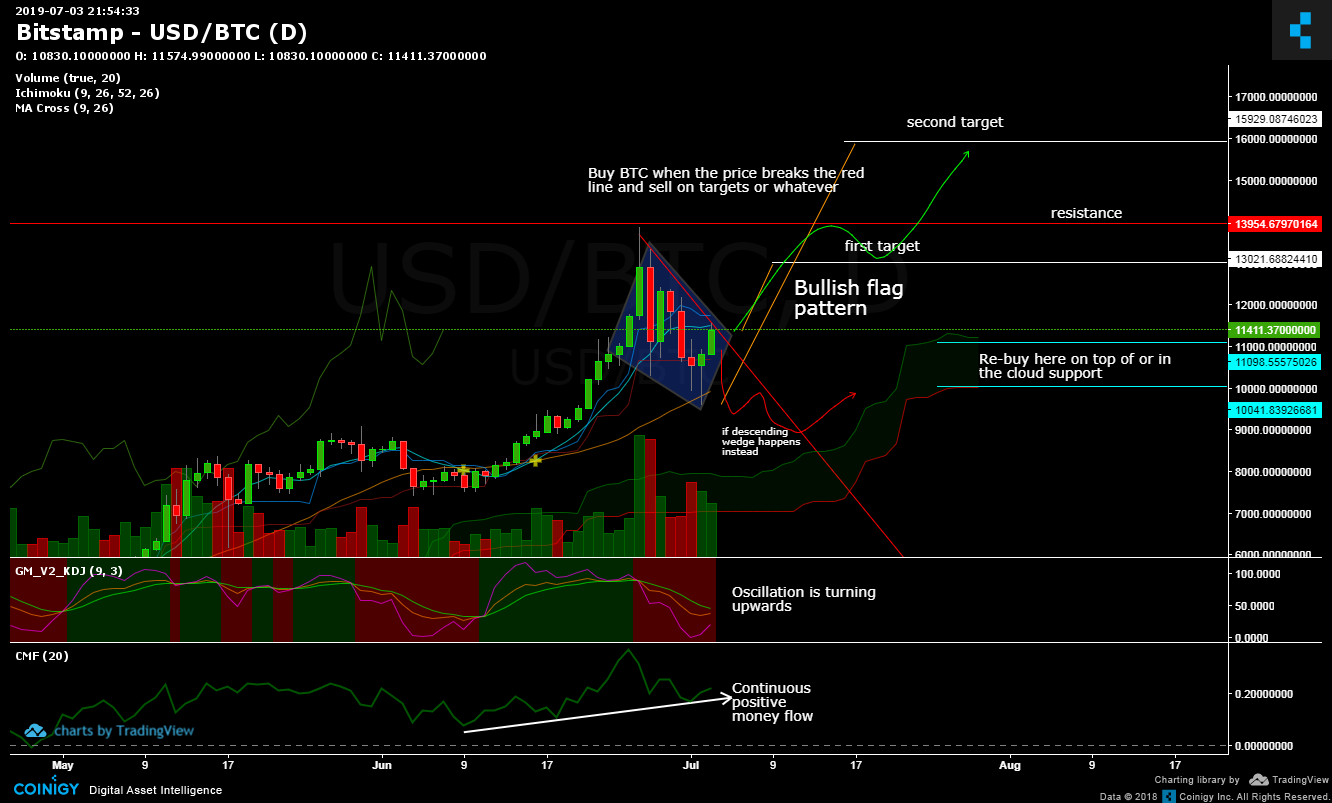
So, what we have here is either a bullish flag pattern or a middle of a forming descending wedge pattern. In any case you buy the breakout of the red line indicated in the daily chart. It aligns with both patterns.
Both patterns are still bullish.


