Bitcoin tops out at $42,000, where to next?
So, my dilemma is whether this is really a temporary correction or will it be an extended trend reversal which means another round of the bear market. Yeah, Bitcoin price action indeed looks parabolic from $3,000 to $42,000. However, pundits including myself agree that it’s too short for a bull market to end now. The length of the last bull market was around 847 - 1,064 days, depending when you start counting the first higher high. The current bull run is either 315 or 679 day in, meaning 385 to 532 days are left (February or July, 2022). If you count from the moment the all-time-high price is broken, the last bull run was 245 days, which means the Bitcoin bullrun still has 203 days left because it’s only just 42 days in.
Free Bitcoin copy trading, anyone?
Another reason, why the bull is not over is this:
Don't panic. This is NOT the week to exit #Bitcoin. CMF doesn't say so. Check the whole weekly chart history of CMF in BTC. Thank me later 😊 pic.twitter.com/wuc97fnkpu
— Bitcoin Master (@drei4u) January 18, 2021
Guys @degengambleh @Levovol I hope you are right. This fractal supports ur #Bitcoin analyses. + the fact the CMF indicator has a freakin bullish divergence in the weekly (WHICH IS NOT TYPICAL OF A TOP). Brag points to all of you if right. Besides this cant be a short bull market. https://t.co/K2yE6MBaTu
— Bitcoin Master (@drei4u) January 22, 2021
Nowadays it's like mid-2017 when #Bitcoin first major dip happened after breaking ATH AND #Ethereum or rather ETHBTC began its ascend into what is called "The Flippening." Will it happen again? @Shitcoinstack What about other altcoins? Probably follow ETH's moves
— Bitcoin Master (@drei4u) January 24, 2021
What price action can we see for a little certainty
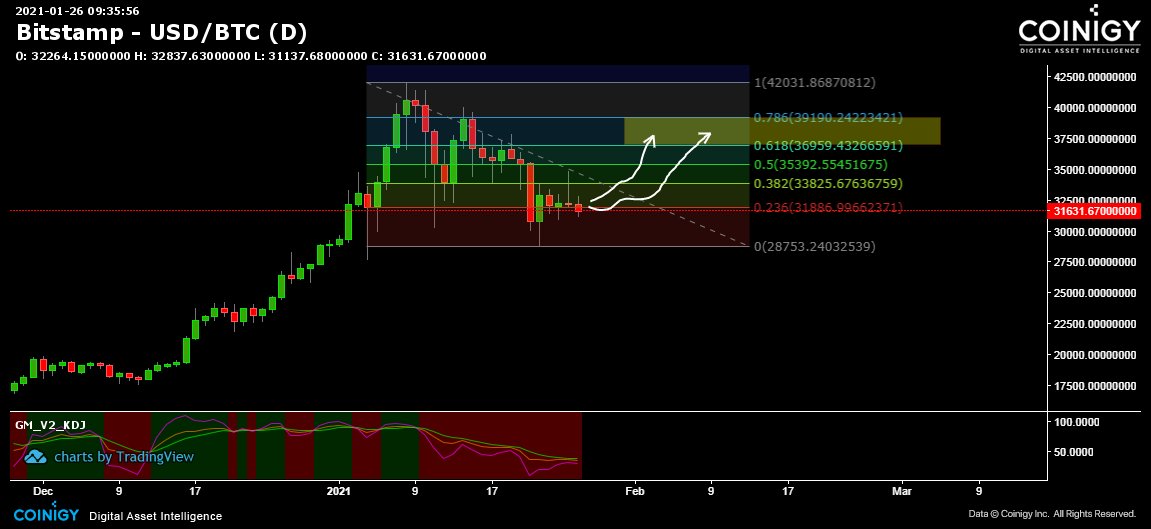
First of all, I charted every Bitcoin pump/rally which resulted in a dump/correction in the daily chart; and then using my favorite KDJ indicator and Fibonacci retracement tool, I can see that Bitcoin bounces to 0.5 to 0.786 fib retracement levels all the time, well except for only one instance. If you want to see all the charts, you can download here.
In the above chart, it assumes the price already reached the lowest before bounce which is at $28,753. So the price could bounce to $36k to $39k-ish before another dump or not. It could be the bull trap or not.
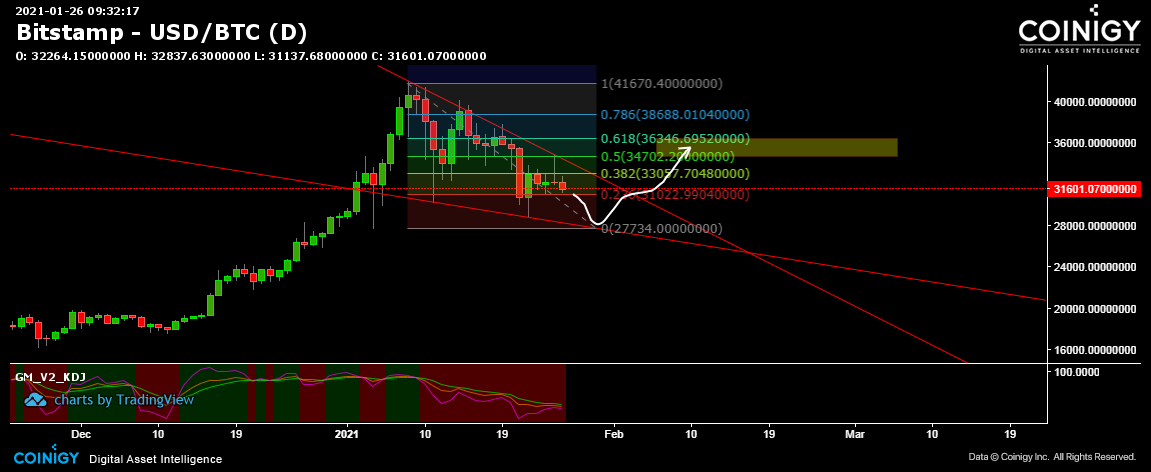
Now in the above chart, this is the prediction of many celebrity crypto Twitter influencers - that the price will crash to $27,000 level before the ultimate bounce back to bullishness. This chart sees $34k to $36k as the target. The falling wedge pattern is a bullish pattern.
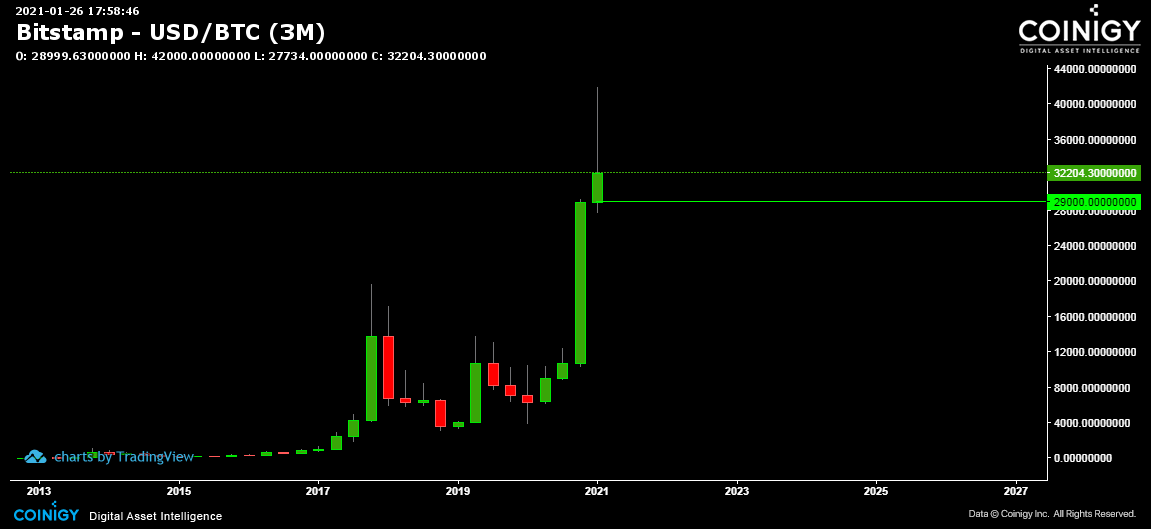
However, I see a problem with this $27k prediction. It would mean that the current monthly and three month candlestick would look like shit and a gravestone doji, which is a very bearish signal on a high timeframe, will signal an end to the brief bull market. Unless of course, the price will stay down briefly under $29,000 before February comes and when April comes.

Price cannot go under $29,000


