Why it isn’t the end of the 2021 Crypto bull market
I’m with you…
- It’s quite unbelievable that a market that grew into a trillion dollar market could now be entering into a bear phase so quickly at just over a year, which is unexpected of a market this size.
- Bitcoin was actually ranging from $50k to $60k for two months! How could it possibly be a blow-off top for Bitcoin? Blow-off tops are typical end to bull markets.
The Bitcoin charts are totally shit.
So, it’s quite confusing. Until I realized that markets are not in isolation or the whole dynamics of Bitcoin and altcoins have changed.
Blame Tether
There was a time when Bitcoin did rule the day. Back then it was the coin pair of choice against a large basket of altcoins. You trade your altcoins against Bitcoin. It was the one true use case of BTC which is Bitcoin being the US dollar of cryptocurrencies, just as USD being the world’s reserve currency, the world’s currency in trading and transactions.
But times change. We are now looking at the wrong charts.
According to Coinmarketcap, Tether, a stablecoin, has the highest 24-hour trading volume at $92 billion while Bitcoin only has $45 billion. Ethereum has $33 billion which is not far from Bitcoin’s. The nearest stablecoin and altcoin has a paltry $5 billion each. So, now, Bitcoin is purely traded for itself and not a a coin pair anymore.
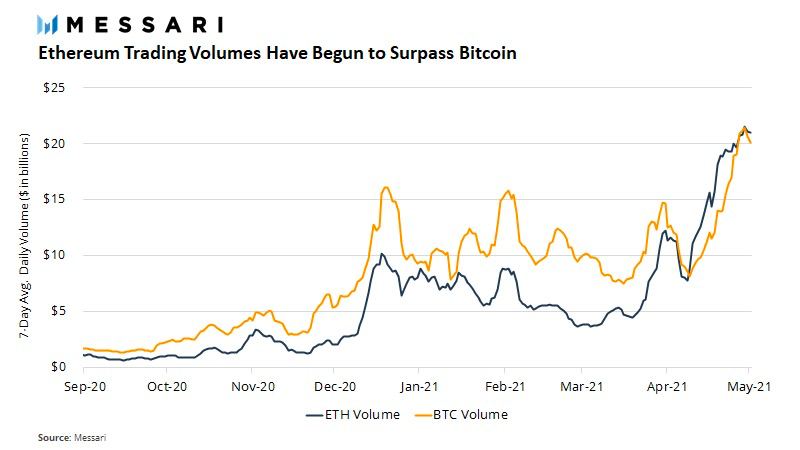
Also Ethereum trading volume has begun to surpass Bitcoin’s. This means more people are trading ETH than BTC, thereby losing Bitcoin’s importance.
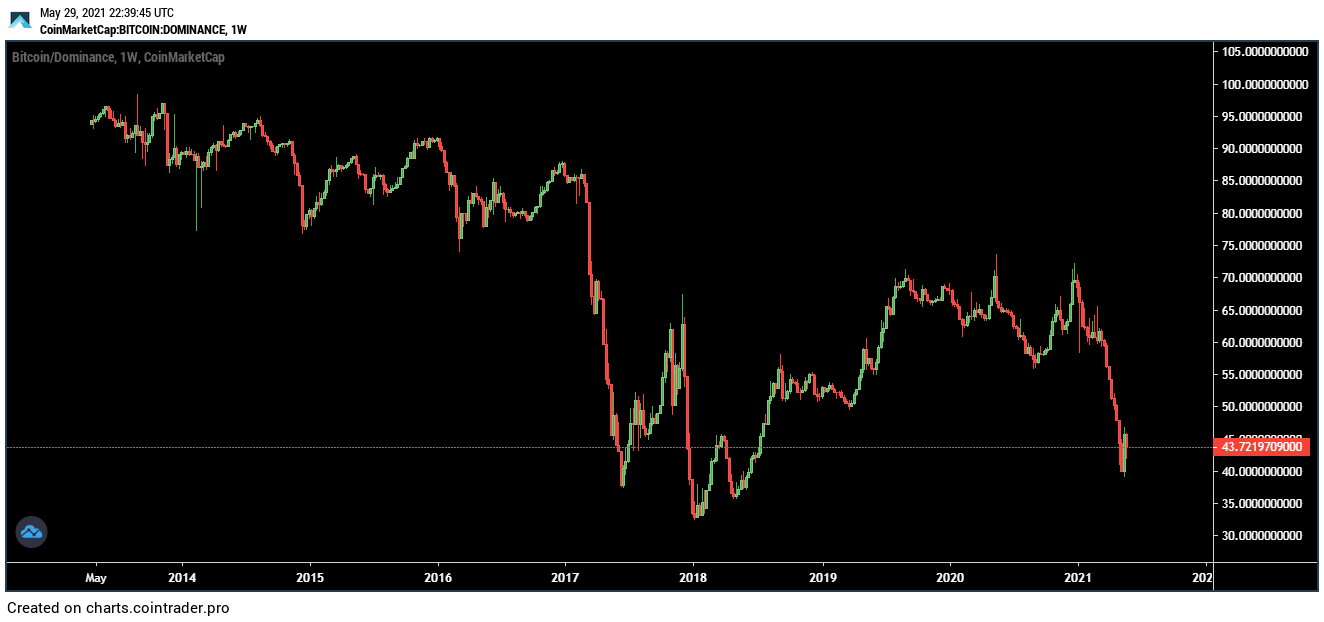
Bitcoin is also losing its dominance over other coins
As you can see the lower the marketcap of a coin as compared to others, the lesser it influences other coins. While 40% plus dominance is still quite high for Bitcoin and still dominating the trend of other coins. You cannot rely on solely looking at Bitcoin charts to gauge market trends of the whole industry. We are indeed looking at the wrong charts.
The other 60% of crypto have their own trends. So, to gauge market health of crypto, you really need to check the chart of all coins, rather than individual coin charts. **
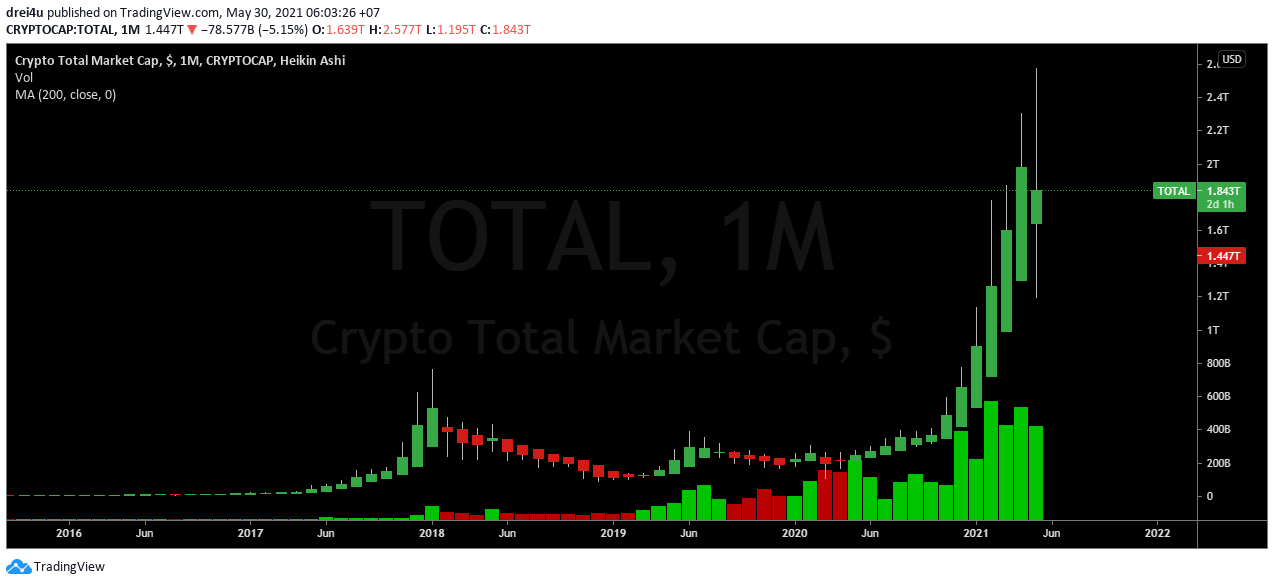
So, what does the totalcap charts tell us? Are we still in a bull market?
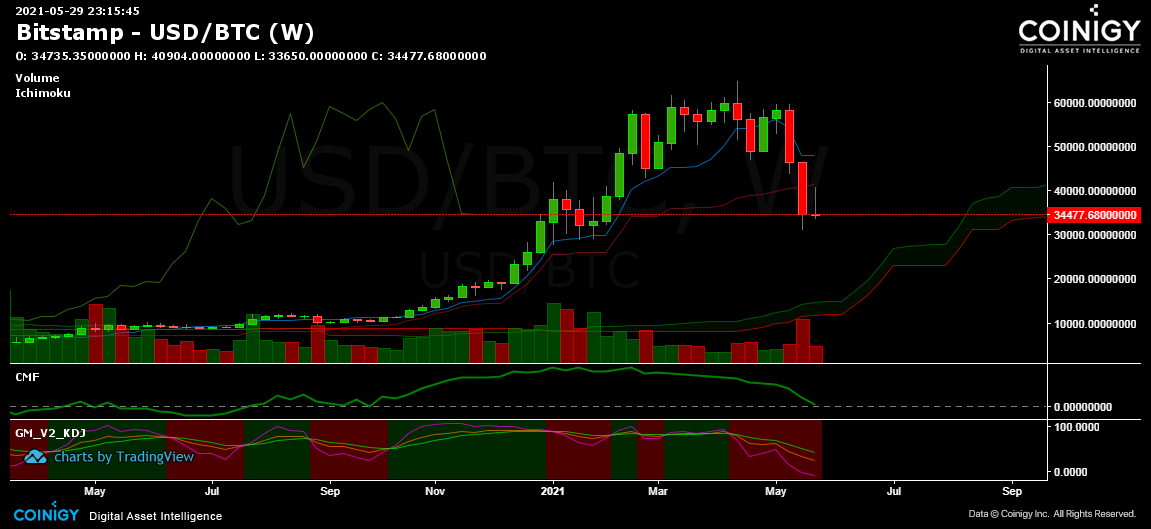
Here you can see that Bitcoin is in the beginning of a bear trend after several months.
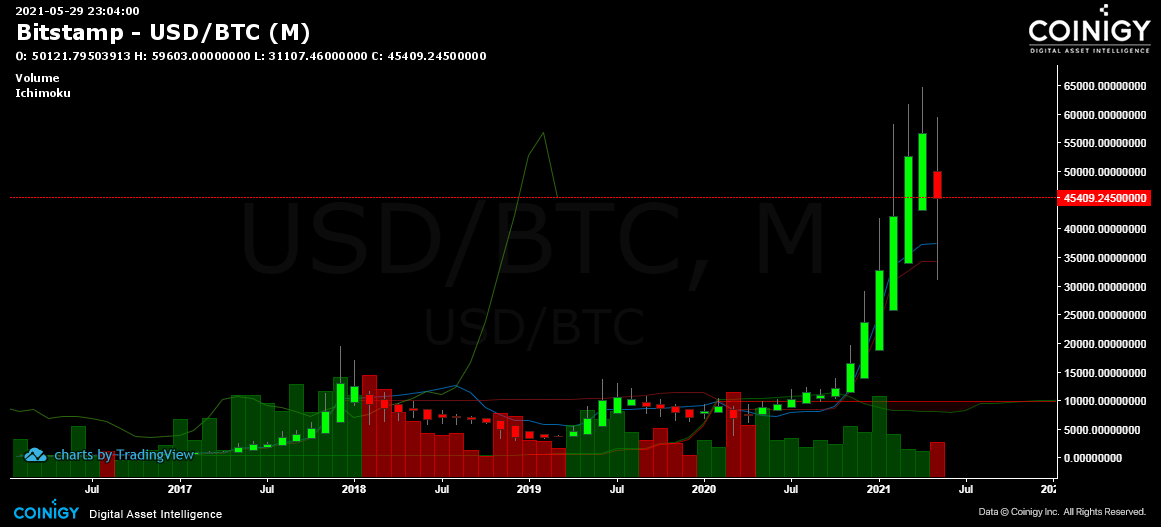
But here the last heiken ashi candlestick is still green as well as the volume.
While Ethereum is still obviously in a bull trend.
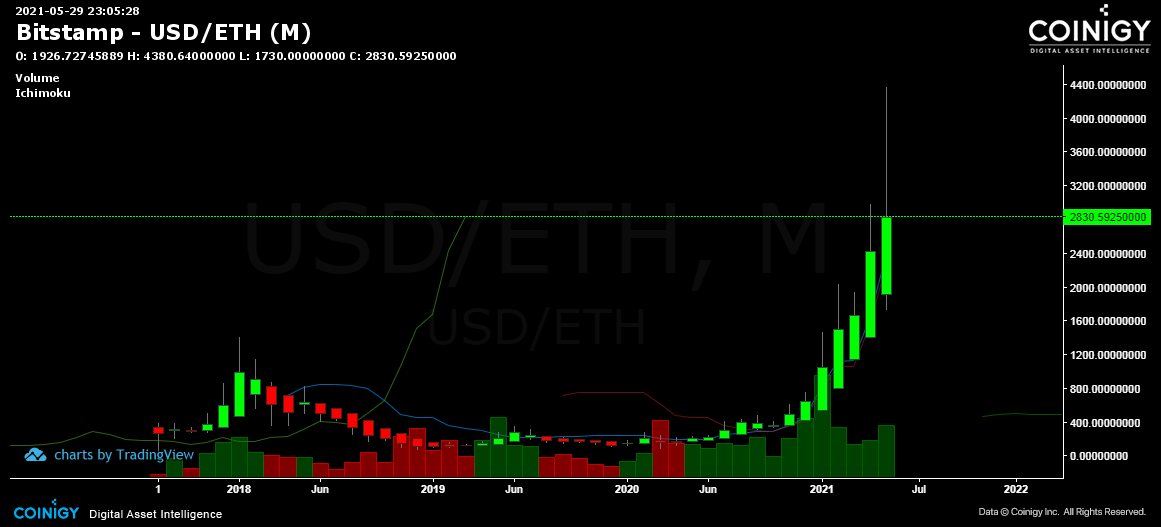
Here the weekly of Bitcoin has several weeks of ranging…
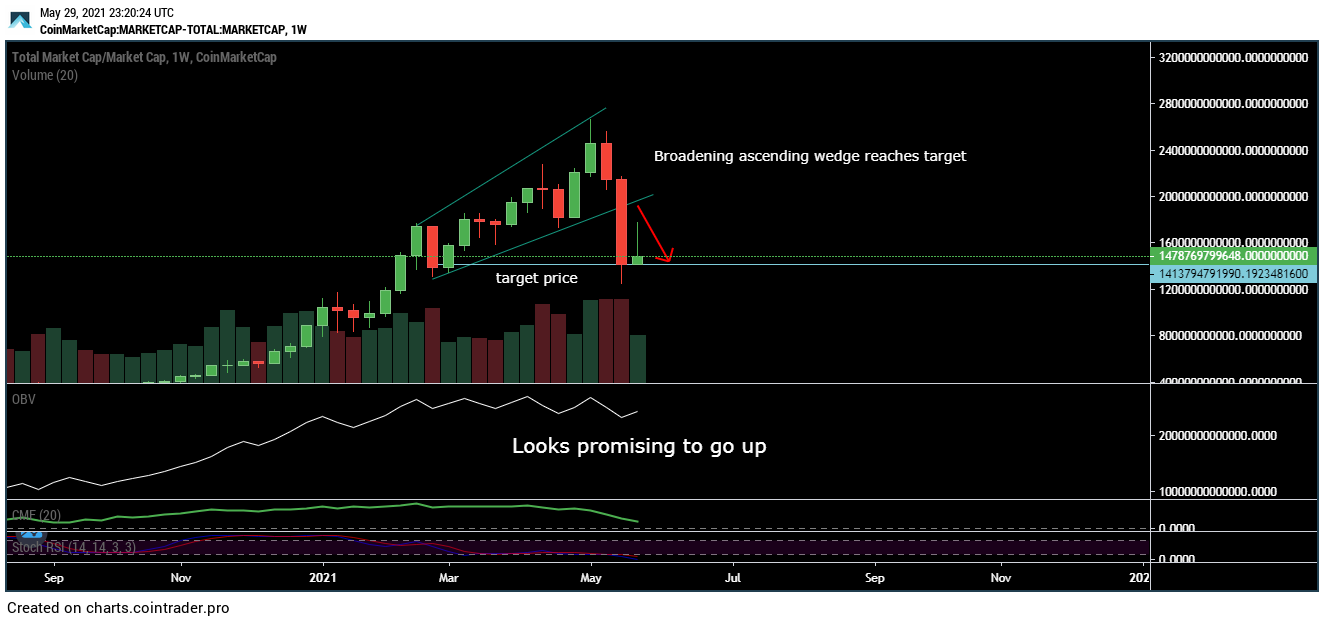
Here is an obvious top formation from the totalmarketcap.
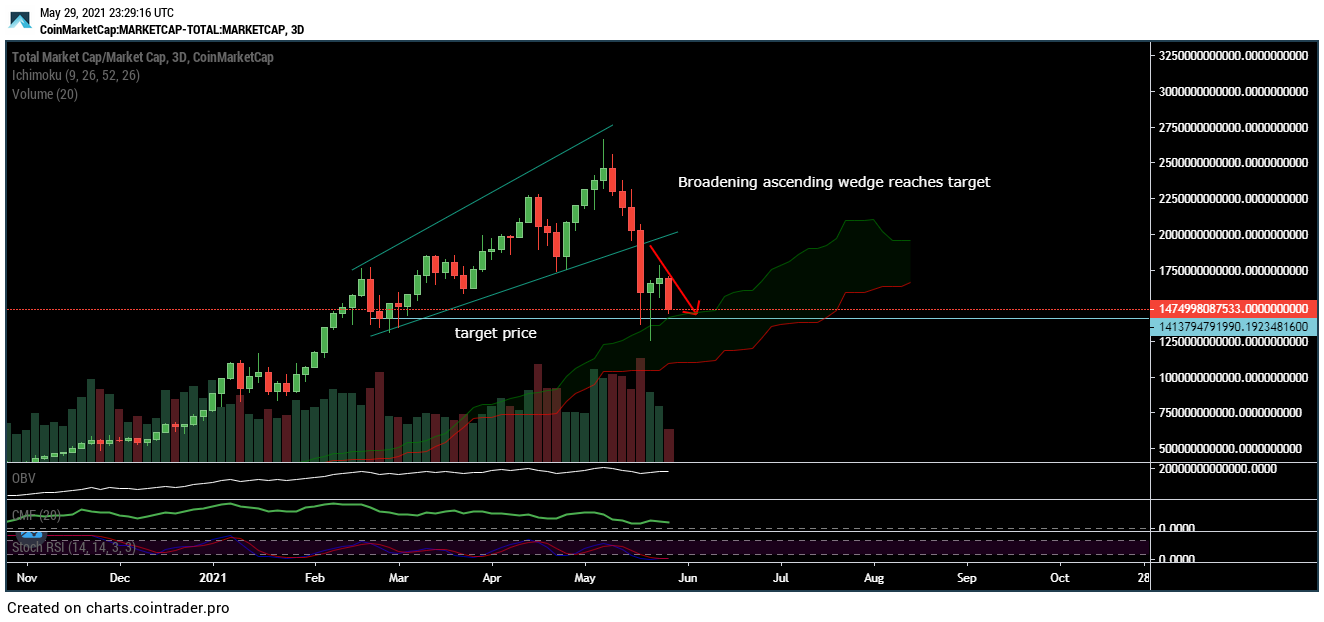
The 3-day totalmarketcap hits support cloud…
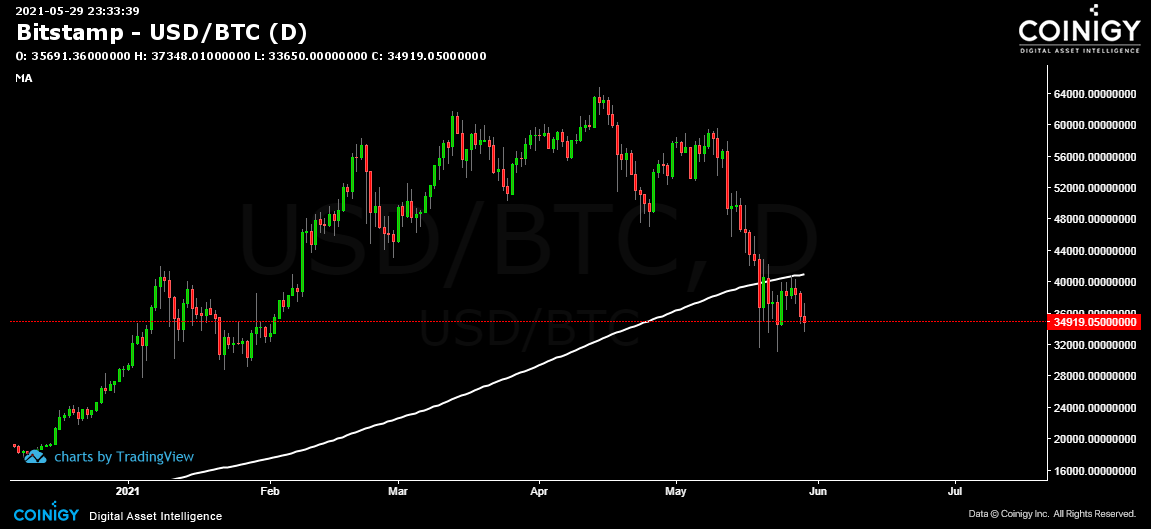
Bitcoin’s price is trading under the 200-day moving average in the daily
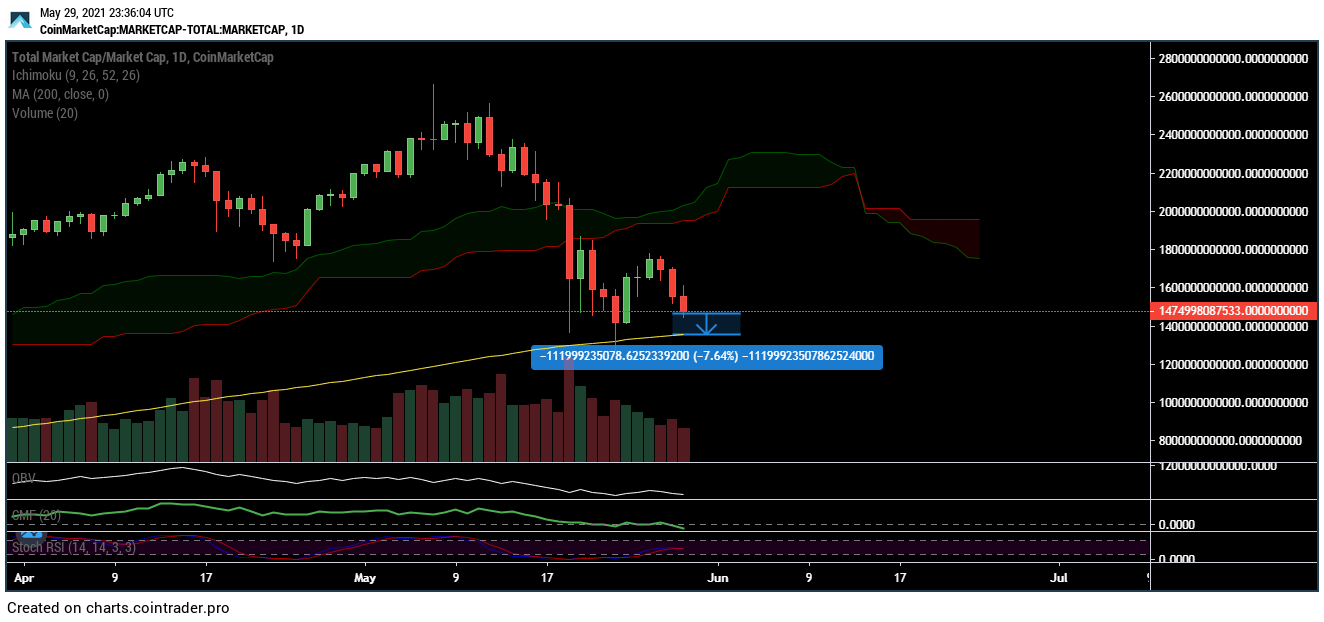
While the total market cap’s daily is more bullish at 7% higher than 200MA…
Also, the previous bull cycle of the total market cap had 45% and 48% price declines, while the recent one is 50% which is not far off the typical. Bitcoin’s price decline in the previous bull market was obviously lower than the current price decline.
In summary, we should always check TA of total coin marketcap because Bitcoin is slowly becoming old and obsolete.

