Bitcoin might break All-Time-High price before year ends
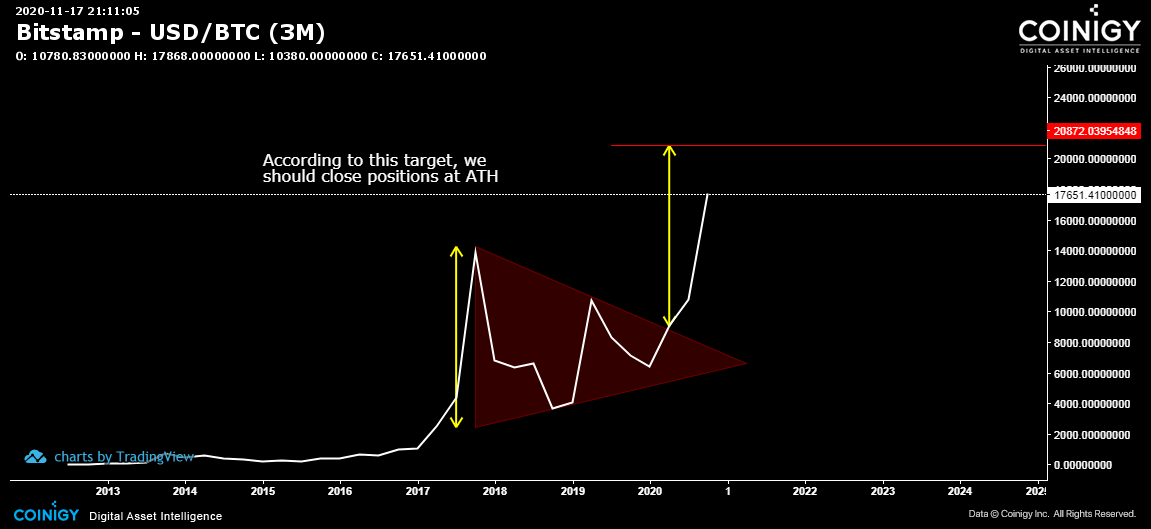
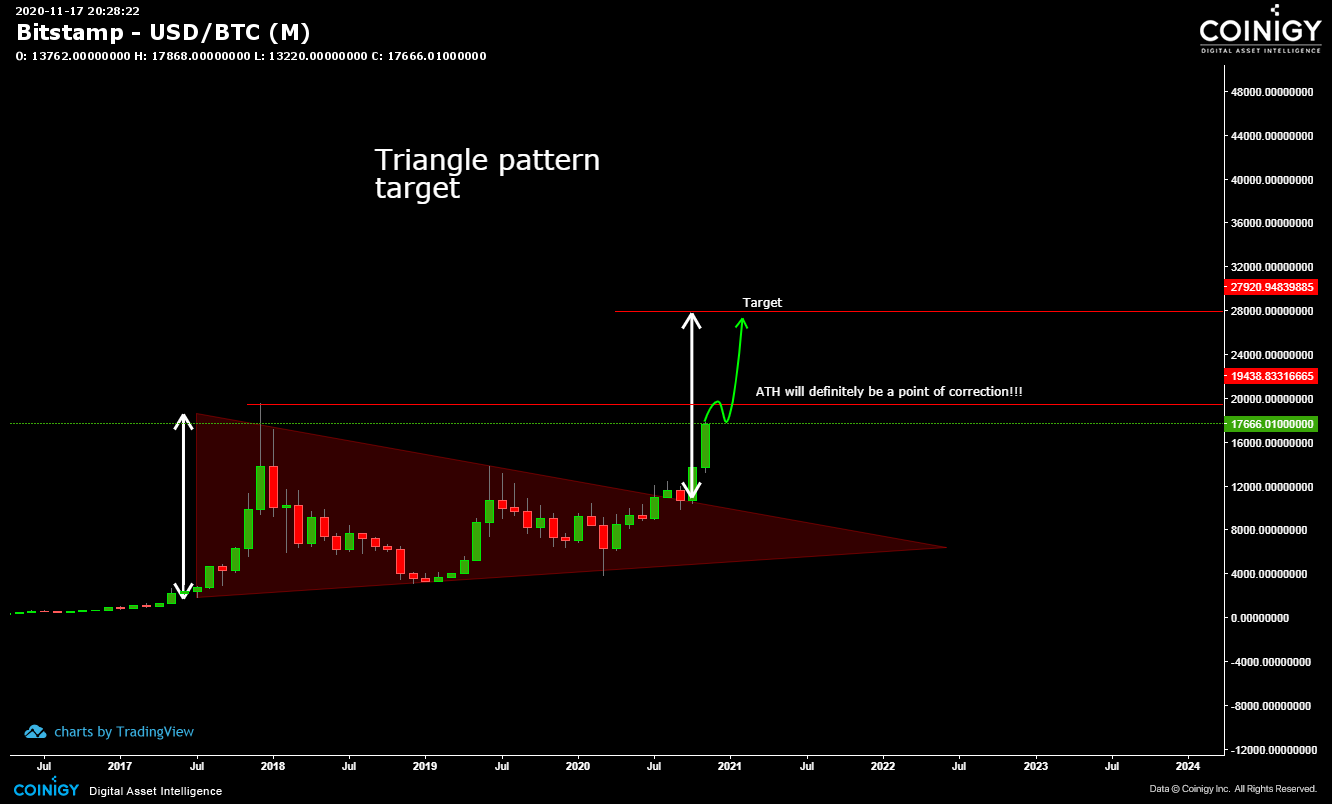
Right now, the Bitcoin charts are showing much clearly that it broke a massive triangle pattern, whether it is symmetrical or not, it doesn’t matter. We just need to know where are the possible target prices.
Using a line chart for the 3-month chart, it suggests we close positions at the all-time high price.
The monthly chart shows the target price at $27,920.
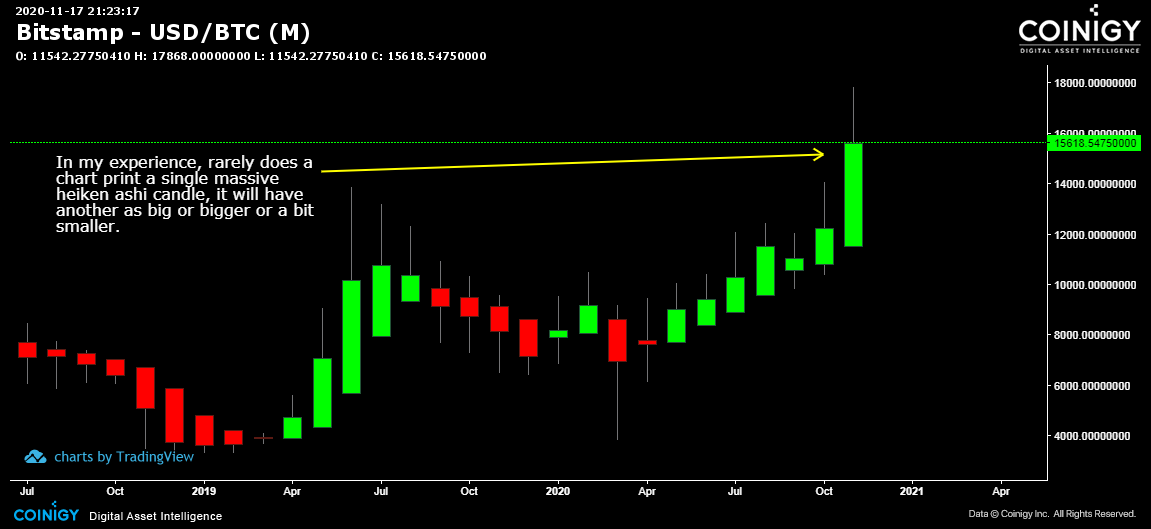
Check out the massive Heiken Ashi Candlestick.
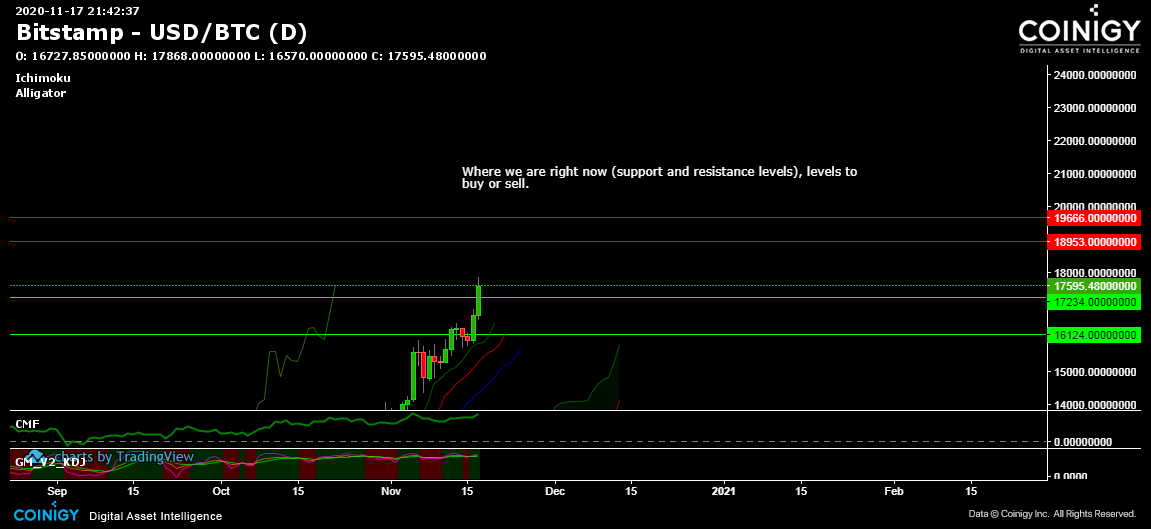
Today we are watching what will happen to the support and resistance levels in the daily. I would buy around the two support levels between $16k to $17k. And then sell for the slight correction around $19k level. I’m positive ATH price will be broken this year.
By the way, are you interested in free social trading for bitcoin?


