Bitcoin Price Prediction Chart: All eyes on July 21
In the BTCUSD monthly chart, you can see that the current candlestick is a shooting star, which is a reversal pattern. This is really bad as Bitcoin price is most likely to retest support levels.
The price has to go and stay above $10,761 to maintain trendline A for August. There are two weeks left for the bulls to reverse this.
If this trendline A breaks, the price might bottom out around $9,058 in line with trendline B.
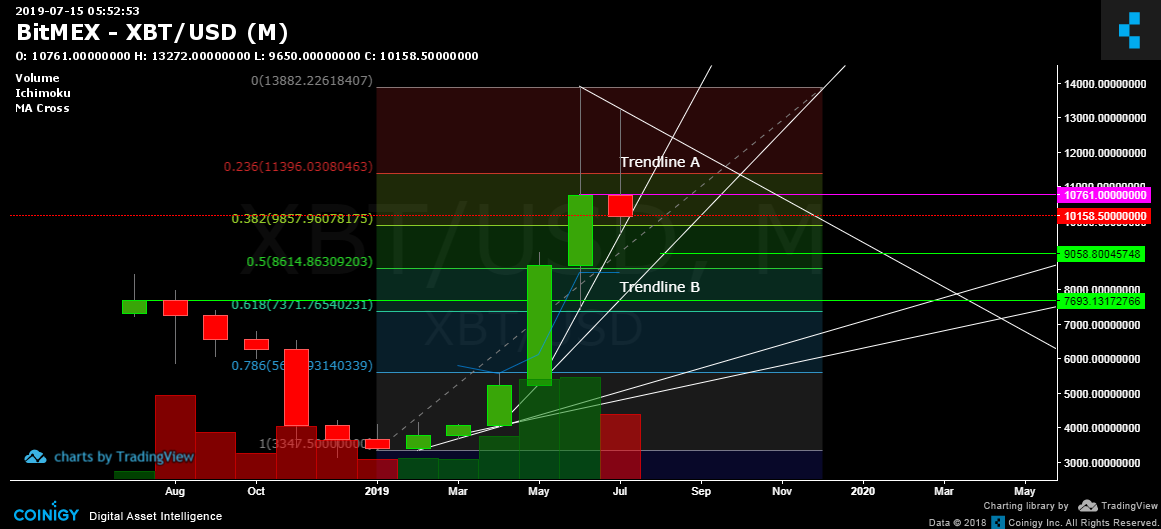
I will not explore the other two trendlines as they are still a remote possibility. But you can see they are within the usual fibonacci retracement of Bitcoin which is around 61.8% to 78.6%. This gives a lot of shorting opportunities for the Bitcoin bears. The $7,693 target interests me since it is also around a support level.
Two Week Chart
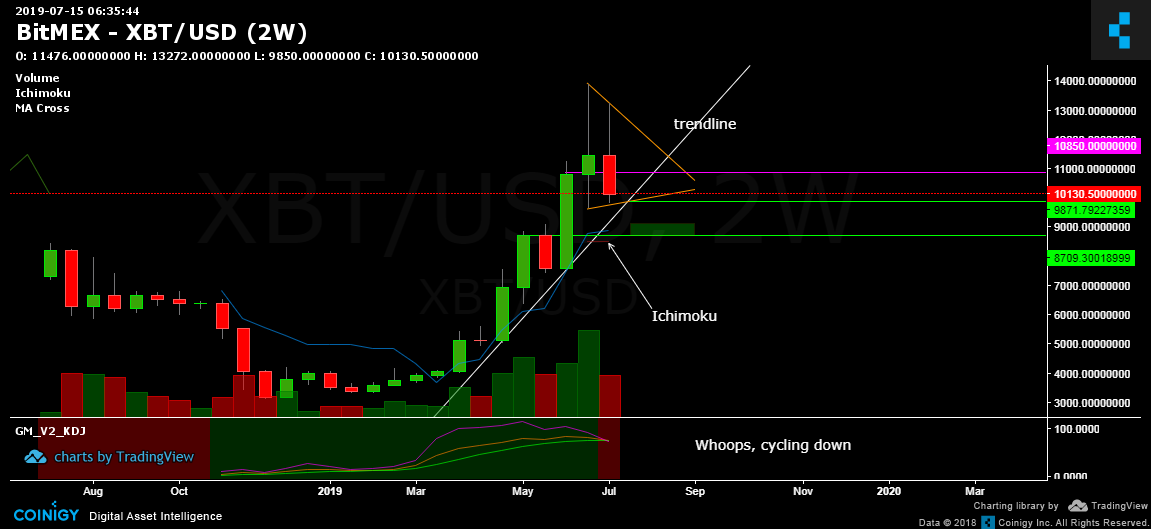
This gives a grimmer outlook as the current candlestick is a bearish engulfing type with a very long upper wick to boot (not good at all). well, the previous candlestick (A shooting star) gave an indication anyway. The bulls also only have one week left to change this candlestick.
Uber bullish Bitcoin maximalists can start accumulating around sub $10,000 anyway since they believe Bitcoin price will reach around $30,000 to $60,000 per Bitcoin. they can buy around $9,871 since it is within some sort of bullish pennant. And they can preserve the trendline indicated.
The KDJ Indicator started cycling downwards which means we have two weeks to 1 - 2 months of retesting support levels.
The price will likely fall towards trendline B in the monthly chart and top of the two week Ichimoku Tenkan and Kijun (red) line. This charts show it is around $8,709 to $9,058.
Weekly Chart
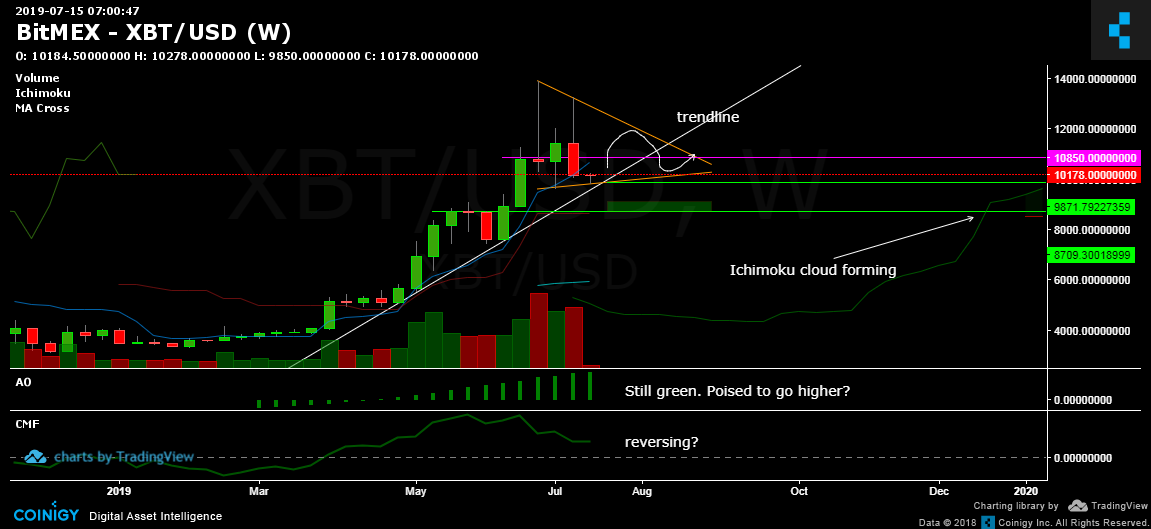
Here in the weekly chart, the outlook is more bullish than the higher timeframes. The Chaikin Money Flow indicator (CMF) say money is flowing in (from 0.149 to current week 0.151).
The Awesome Oscillator (AO) although lagging, is still a favorite of mine since it can be the last confirmation of a trend change and rarely have one period changes. The AO still indicates green so the price could try for $12,000.
Both CMF and AO supports the bullish pennant possibility. Looking forward, the ichimoku cloud support is forming just below the supposed pennant.
Also, the current candlestick looks like a hammer pattern (not yet final though). The possible set ups here are similar to the two week chart.
Three Day Chart
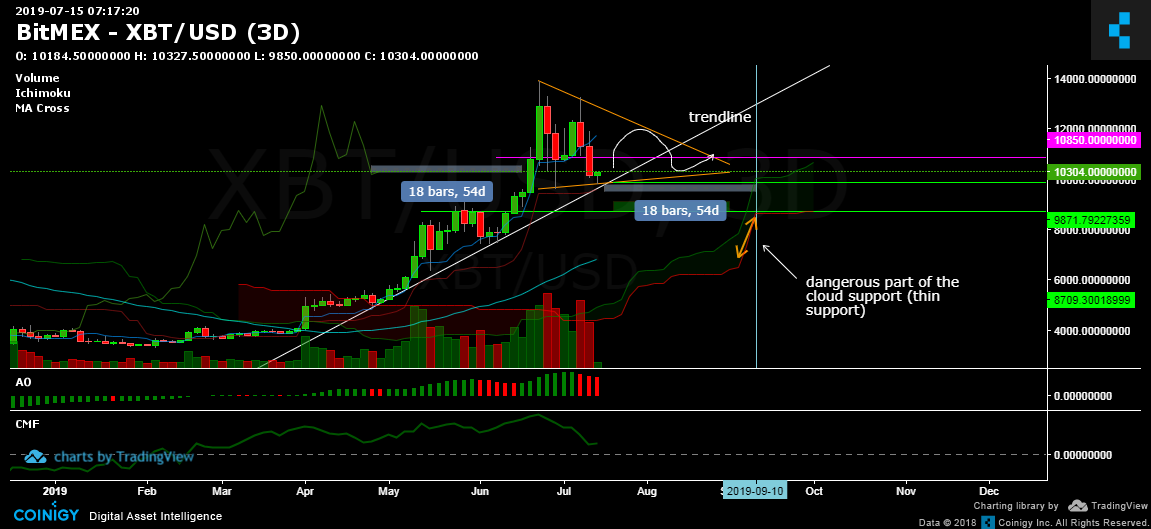
Well, the chart seems self-explanatory. And this chart is extremely bullish. It seems to be forming a right shoulder of a head and shoulders pattern, within a bullish pennant. And the apex of the possible pennant is so close to the Ichimoku cloud of support.
The Chikou span will collide with the candlesticks in 54 days (September 10). It must go higher than candlesticks to preserve the uptrend. And the price will hit the top of cloud also in 54 days.
In fact, if the price falls down to $8,709, it also might be able to break down through the ichimoku cloud in September. So, it is imperative to maintain $10k.
Daily Chart
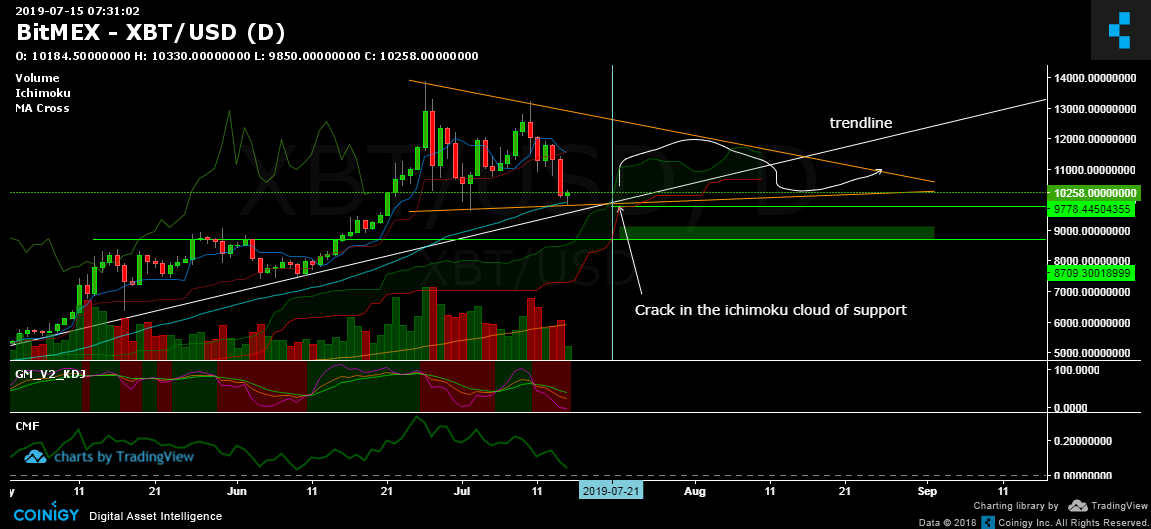
Both CMF and KDJ indicators are not showing any reversals yet. However, the KDJ indicator is in the oversold territory. The J Line is already in the negative numbers. So a potential bounce is in the works in the next five days. Hopefully this bounce will prevent the price from penetrating the cloud of support by July 21.
It is imperative that this happens or else the price might slip through the thinnest part of the cloud around $9,778.
Another thing, the 50-day moving average (DMA) in aqua marine color acted as support. As the price bounced from $9,882.
Conclusion
In the end, the trend is your friend except at the end where it bends. We must still assume we are in a uptrend until the price bends and goes below the daily cloud support around July 21. If that happens, we will be looking more at shorting targets.

