Bitcoin Price Analysis: Still on its way to break ATH
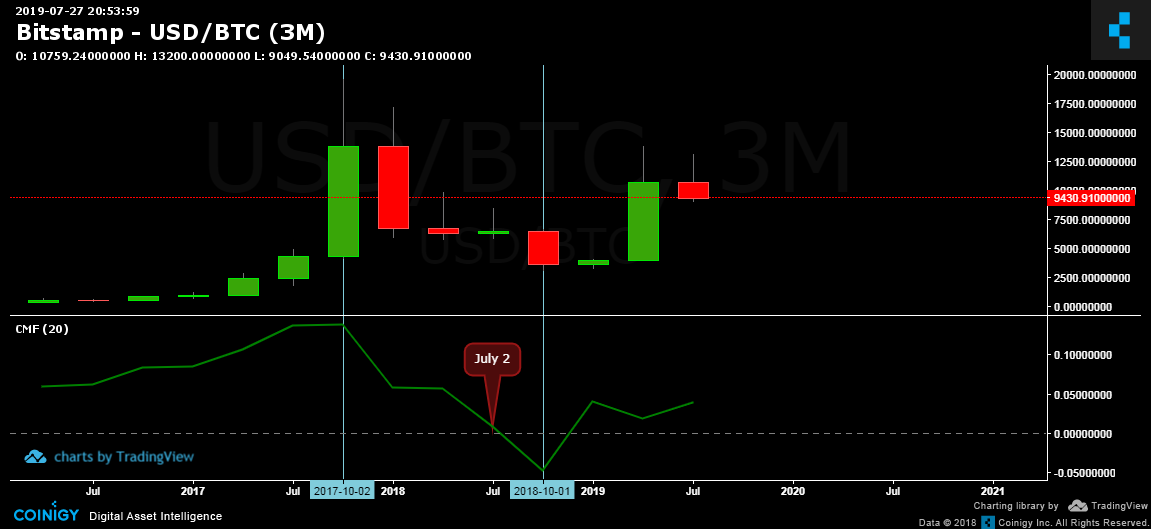
The three month chart shows the Chaikin Money Flow (CMF) started declining since October 2, 2017 when the price is still doing its parabolic advance to $20,000. Money flows turned negative on July 2, 2018 and accelerated further downwards until October 1, 2018.
BUT when Bitcoin is still about to lose 50%, money flows has reversed from the negative and until now it is still going up. At this point, casual investors shouldn’t be worried that they bought high during the rally to $13,000 this year. There is increasing money flows.
Monthly Chart
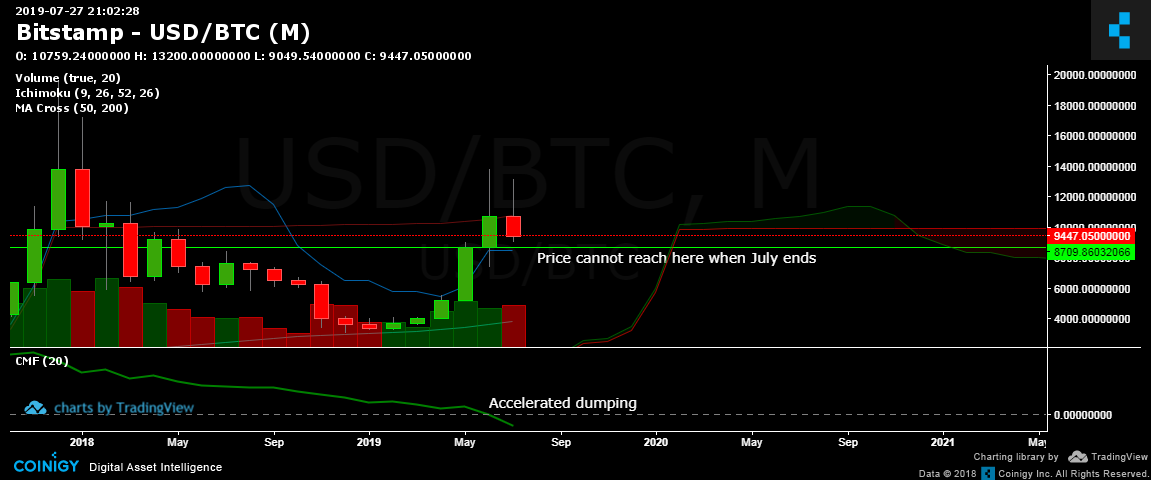
The monthly chart shows accelerated dumping, probably by retail investors who bought $10,000 plus bitcoin during the last bull rally as they are cashing out to minimize losses.
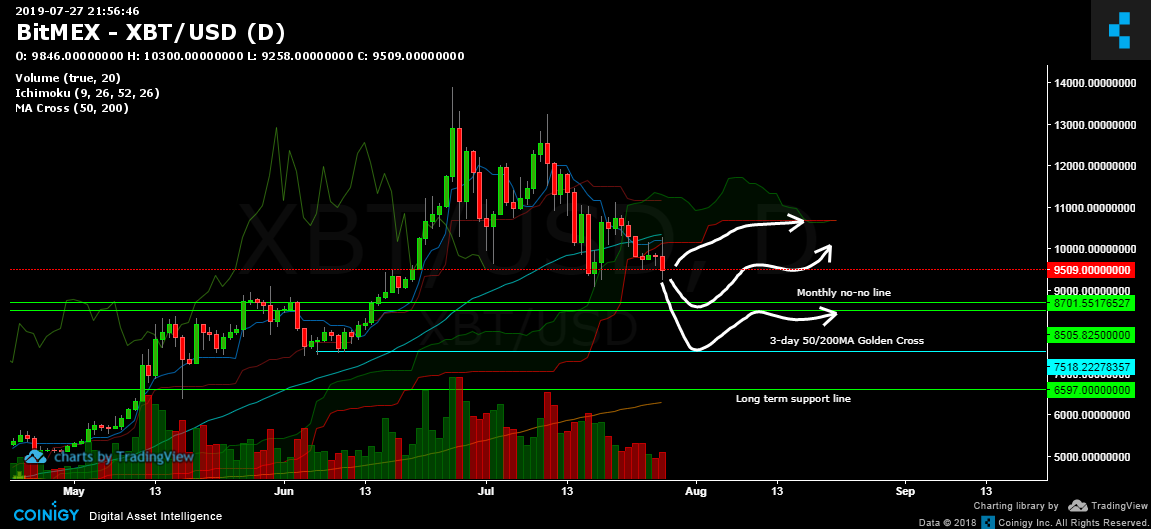
The price cannot reach $8,709 by end of July since it will print a bearish railway track pattern and signal further downward movement in August.
Weekly Chart
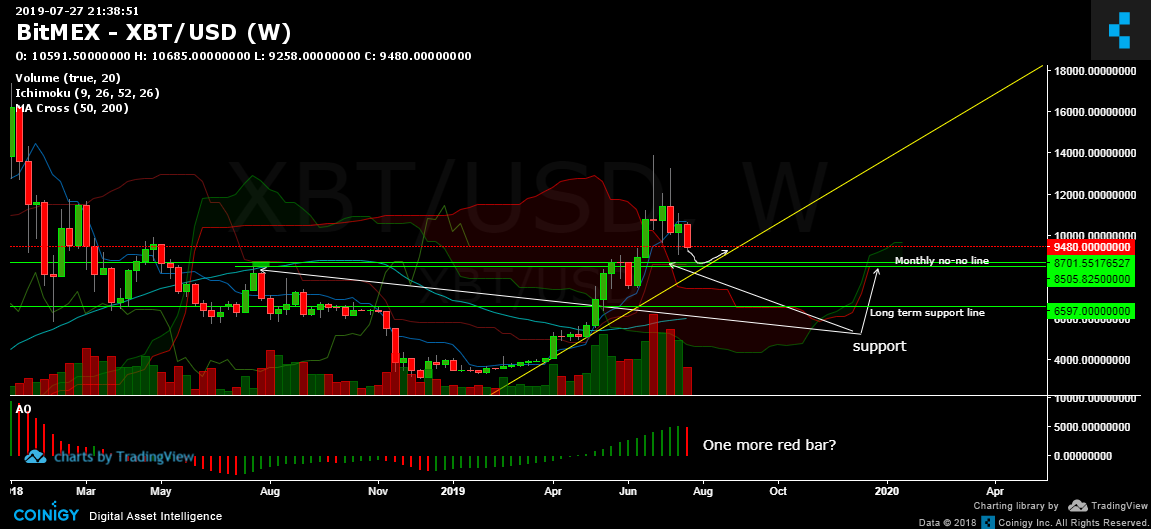
The weekly chart shows a diagonal trendline with higher lows made during March 25 and April 29. It is still intact if the price bounces off the monthly no-no line/Kijun line of $8,701 (refer to the monthly chart above regarding bearish railway). If this doesn’t hold, we will see $6,597.
Three Day Chart
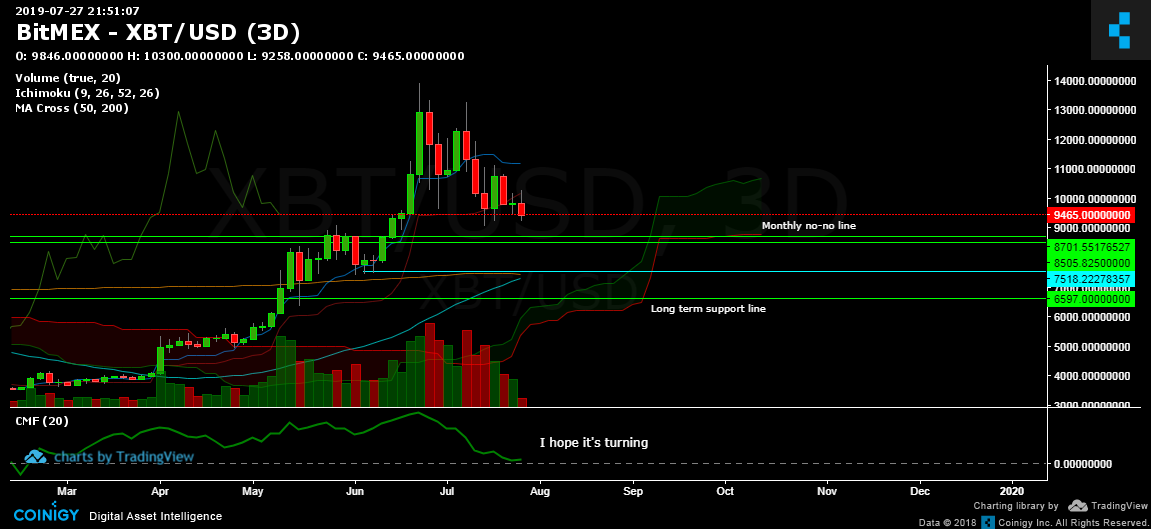
If you think #bitcoin is still correcting, btfd. $8500 is a gift, $7500 is an all-in! https://t.co/g9ChUgnp4z pic.twitter.com/GKf1tIinVh
— Bitcoin Master (@drei4u) July 25, 2019
The three-day chart analysis still stands. My tweet compares the present chart with the previous three-day chart that showed what happened during the 50/200 Moving Average Golden Cross of January 31, 2016.
Daily Chart
Conclusion
You can try fade shorting but never try to short along the support lines. Bring out the four hour chart, you can see it’s forming a descending triangle. You can fade short from the top diagonal resistance line.
The outlook is still bullish long term. The support areas mentioned are the prices you should watch out for buying. Try scaling in your buys little by little along the support lines.

