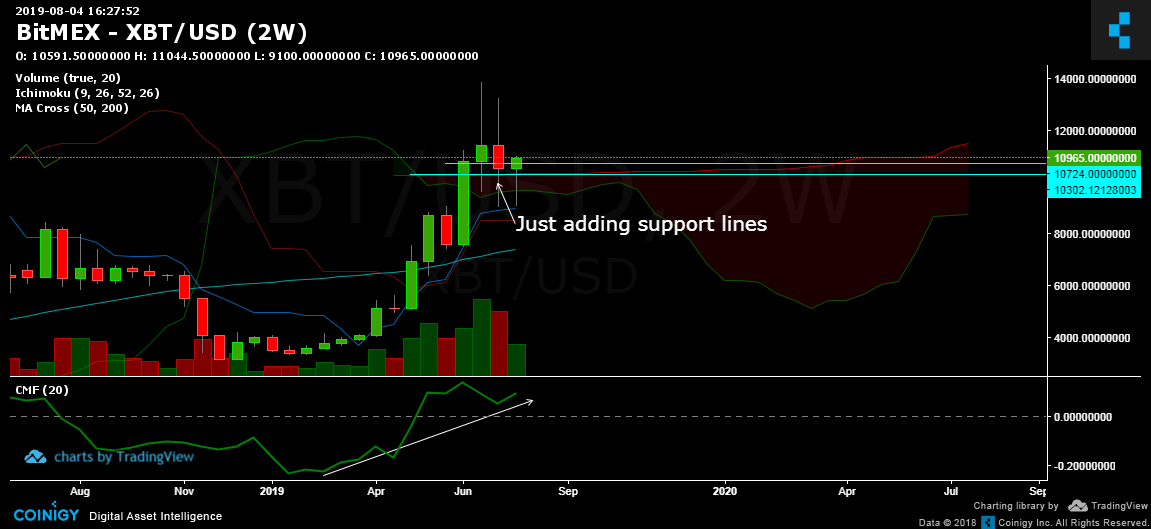
Bitcoin about to blast off if the weekly candle closes engulfing
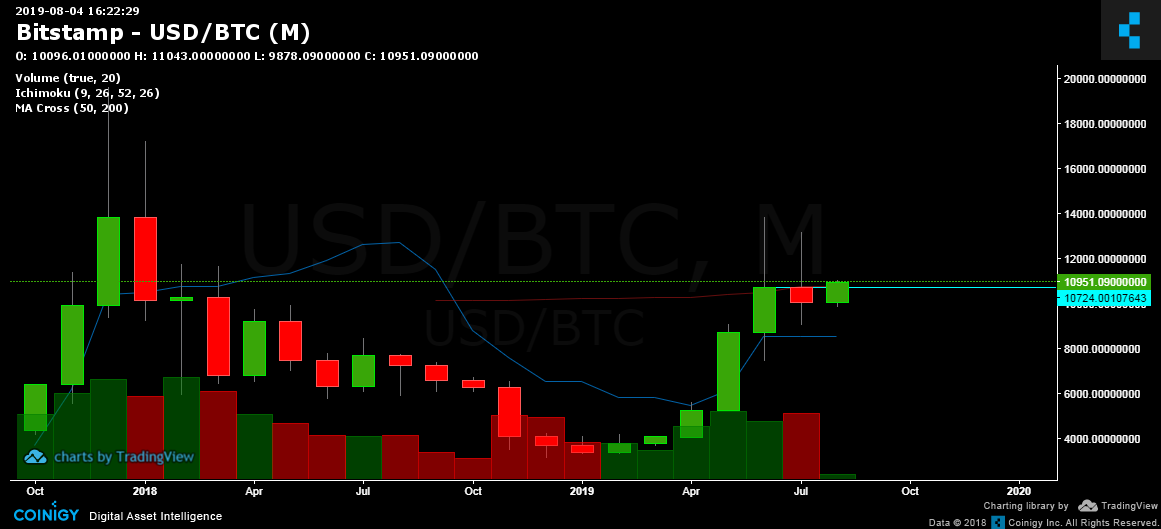
The month chart shows the kijun line aligns with the monthly support/resistance line at $10,724. That bullish engulfing candle is not yet finalized so don’t take it as a signal yet. So maybe neutral, may correct, consolidate, but a bit bullish since the candle is out there forming.
Just look at the long bottom wicks, someone’s accumulating.
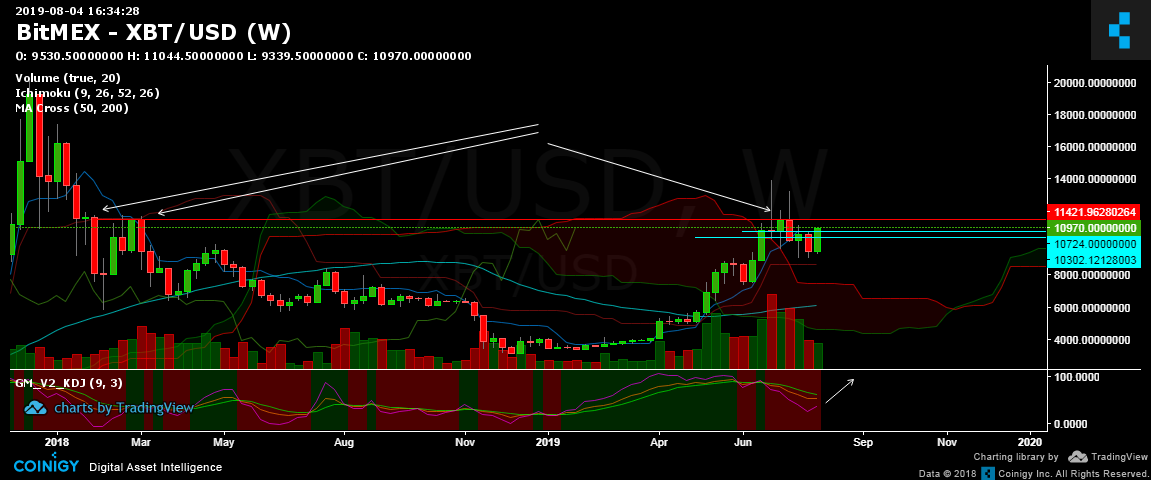
Weekly Chart
So the weekly chart has a short term target around $11,421 based support and resistance levels. The price will likely reach there because of a bullish engulfing pattern forming and it will be final in a few hours.
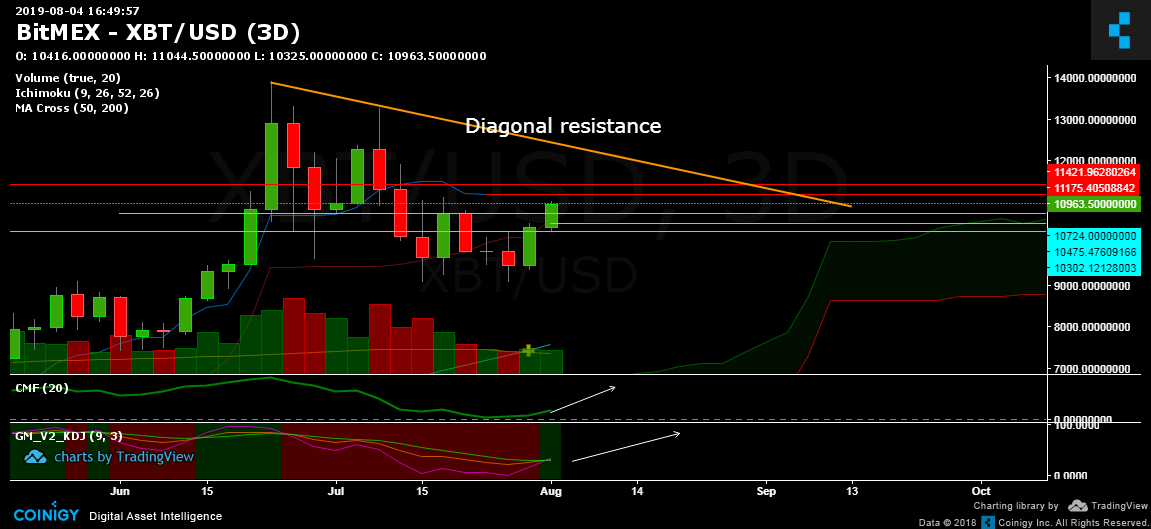
Three Day Chart
You can see the Ichimoku cloud almost perfectly aligns with the support lines I’ve drawn from higher timeframes. Also added resistance/support lines based from Tenkan and Kijun lines.
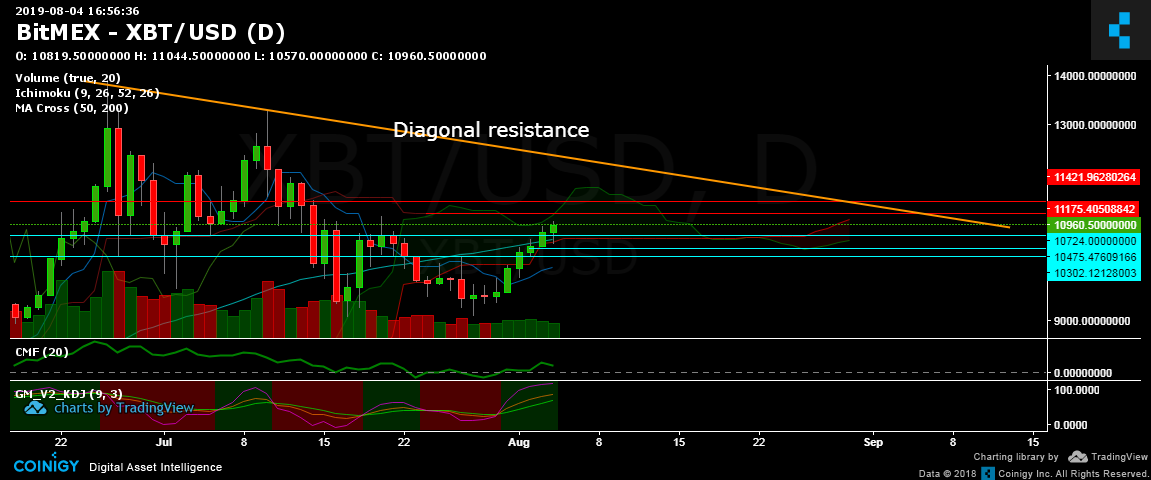
Daily Chart
Probably hit $11,175 or more likely $11,421 which is the top line of the daily Ichimoku cloud (resistance). And then it will correct to re-test the support levels indicated.
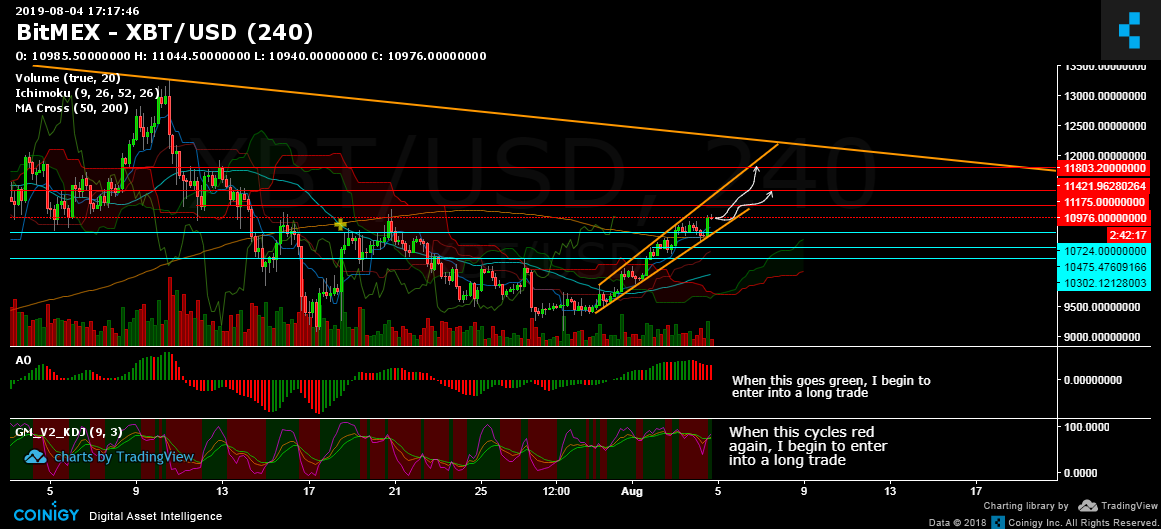
Four Hour Chart
There’s no bearish formation. There is a channel testing every resistance levels up to $11,803. For daytraders, these could be your “Take profits” TP levels.
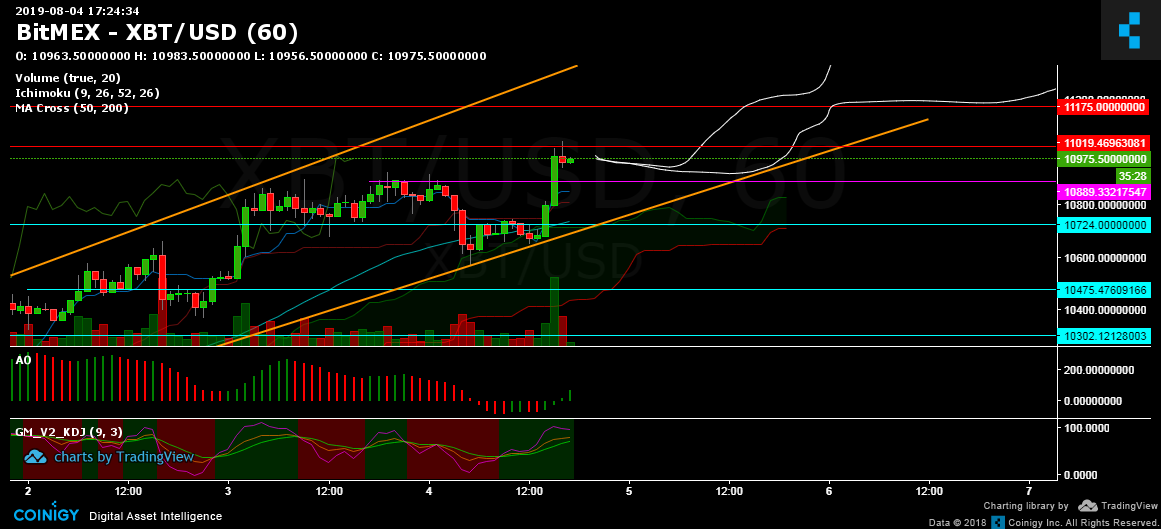
Hourly chart
Smoy asks when to enter into trade: During a pullback or when it breaks a resistance level? Looking at the hourly chart, I would rather buy the breakout of the resistance at $11,019 because the price is much nearer there. The second option is buying the retest of the nearest support level at $10,889 when the KDJ indicator turns red (hourly) and then about to turn green. This could go deep so, wait for the KDJ to turn green again.

