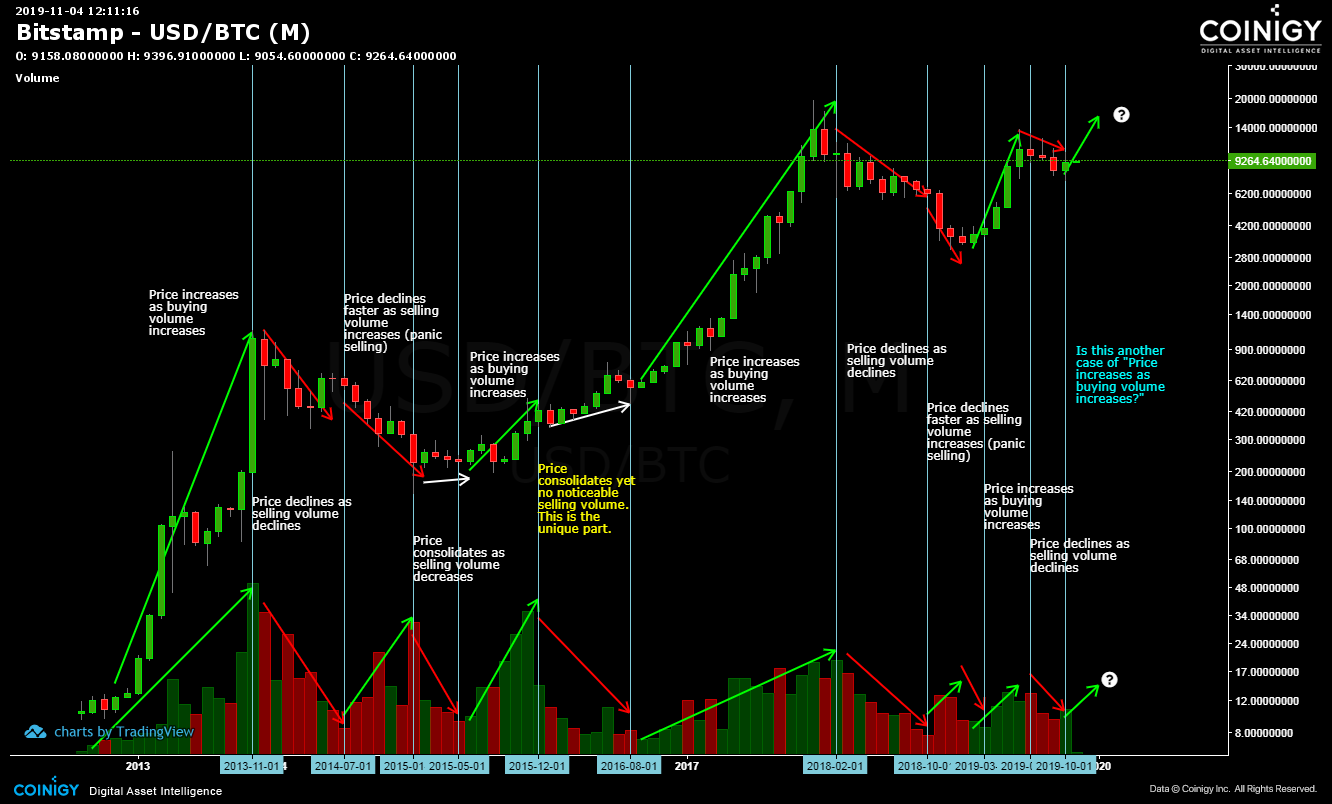
Entire Volume History of Bitcoin Maps Human Greed and Fear
Avoid getting chopped out from seemingly trendless low timeframe charts, monthly and weekly charts are your go-to charts. As I promised, this simple TA shows how Bitcoin price is influenced by human greed and fear.
Analysis
From the chart above, you can see there are three main phases of the market. The first one is a consistent rise in price accompanied with increasing buy volume. The price becomes parabolic that the buying pressure cannot sustain the price.
Thus the second phase comes in with the highest sell volume and a gradual decline in volume. It happened three times in Bitcoin history: the November 2013 period, February 2018 and July 2019.
The third phase involves panic selling or capitulation. As price crashes, the sell volume increases. You can call this an inversion of the first phase. You can see it happen at July 2014 and November 2018 periods.
Next Following Months
October 2019 volume is green (more buying) and higher than September, it’s even higher than the August trading volume. This tells me that October might be the start of the first phase again.
Let’s come back to this post after November ends and see if the trading volume is higher than October and is green. Or maybe this is another case of the consolidating price similar to December 2015 to August 2016.


