Trading Bitcoin post-Segwit Activation and prior to Segwit2x Hardfork in November
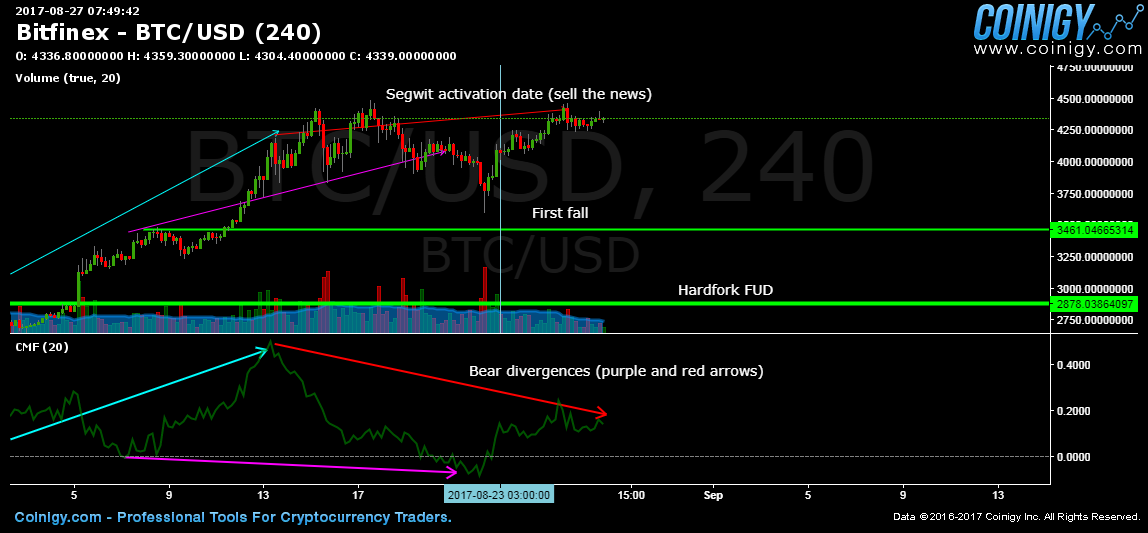
First of all, there’s no more hype to fuel the Bitcoin rally anymore (Well, maybe until the Lightning Network is ready to be launched) and also the cryptocurrency network has a new challenge coming in November that could potentially disrupt the network’s stability — when majority of the miners decide to implement a 2mb blocksize increase in which almost all core developers are strongly against. This is supposed to mean that many will sell their BTC to avoid the confusion and probably buy back when the opposing camps go their separate ways. What’s the FUD here about? The loss of miners’ hashpower would result in long block times and large pool of unconfirmed transactions, thereby, most will not be able to move their BTC for quite some time.

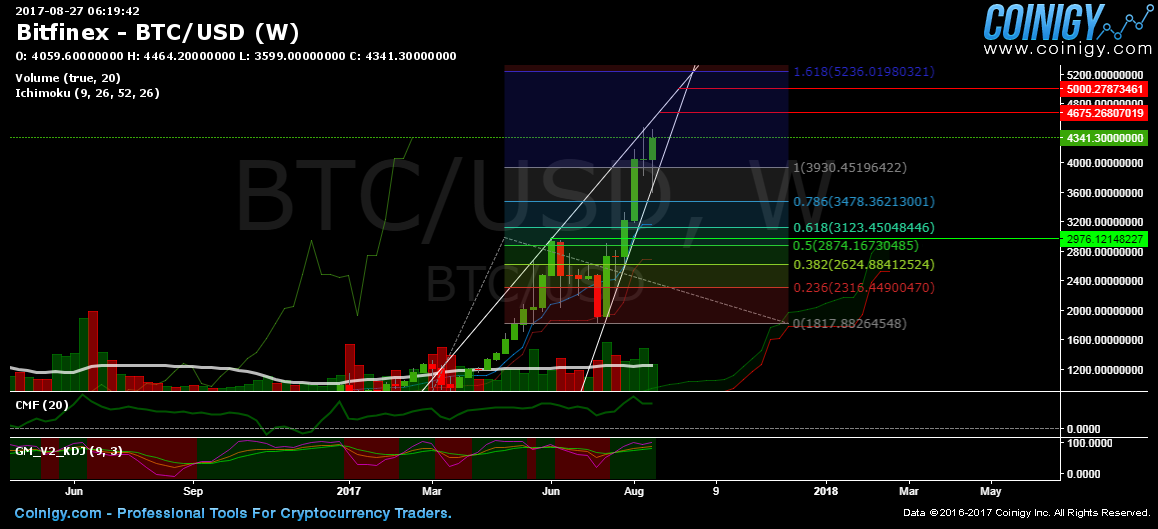
The weekly chart already showing an ascending wedge which is a bearish formation when the lower uptrend line is broken down. The target would around $2,976. The market cannot realistically go up to an almost 90 degree angle, it needs to correct soon without sacrificing its bullish run.
However, there is still room to go higher to $4,675 — $5,000 if the unreasonable fervor of Bitcoin buyers go on unabated.
The Chaikin Money Flow (CMF) which measures buying/selling volume shows a bearish divergence from 0.2813 to 0.2796. The K Line (faster line) in the KDJ Indicator has already reached 99.69 which is usually the peak for many cycles (sell signal). However it could still reach 106 (last reached in October 2016 and almost during April 2017) to 110 (last reached in July 2015).
Buyers at $1,817 dip are still hoping to close positions around the fibonacci extension of 1.618 (around $5,000).

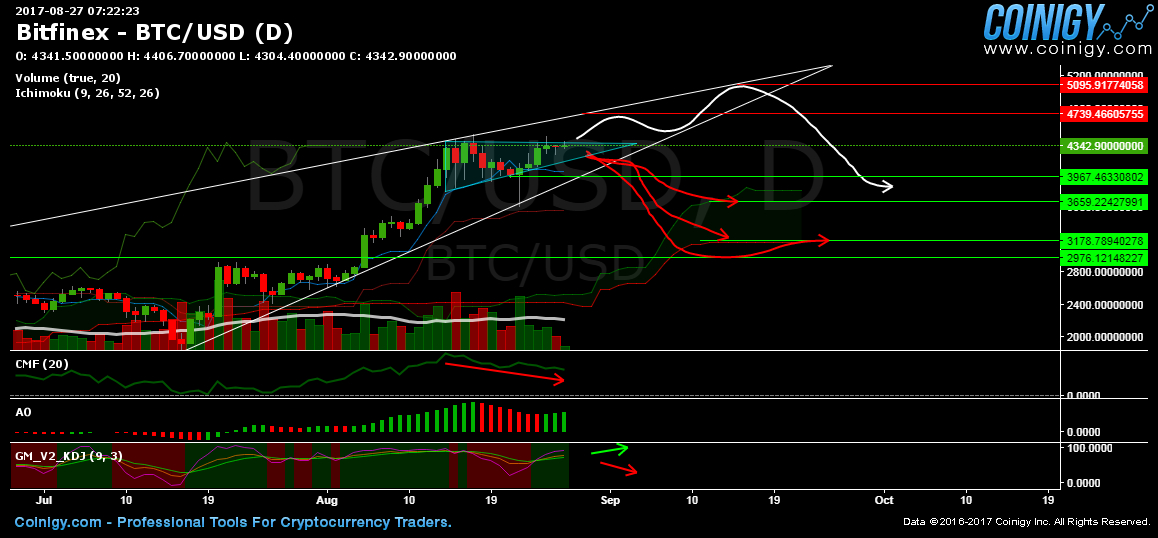
The bulls are banking on the ascending triangle (bullish) to push up the price to $4,739, thereby, continuing the wedge. However, the CMF indicator still shows a bear divergence which means money is flowing out more than coming in. The positive cycle in the KDJ is still up (K Line 93.09 — still has room for 100 though) but weakened.
This is great for small positions to trade long the ascending triangle breakouts but not for large ones.
Old charts:

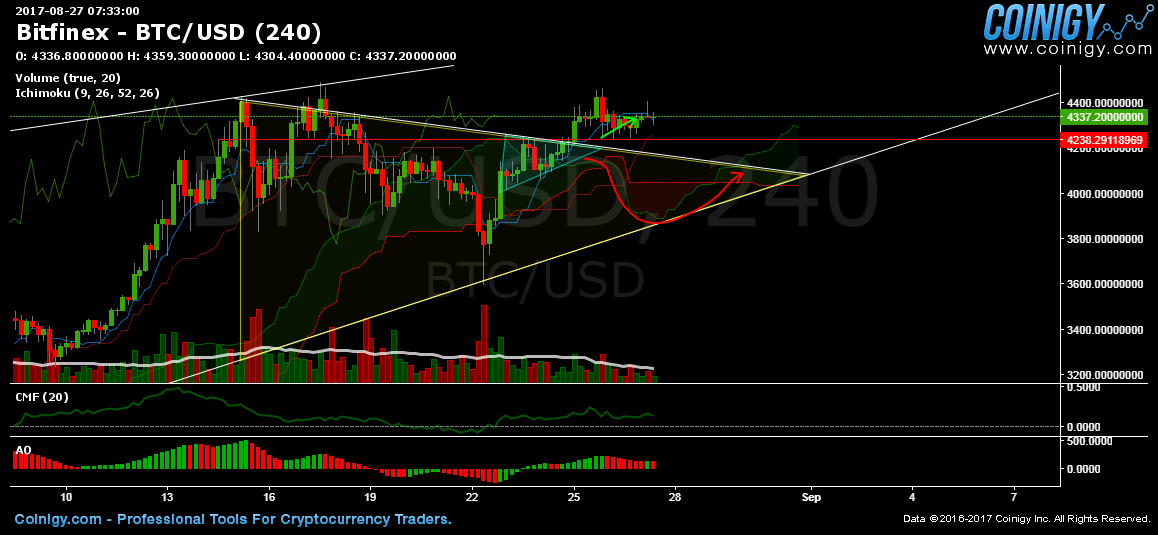
The breakout came true from this chart. The bear divergence now shows in the Awesome Indicator (AO). The price could be attracted to that flat kumo and crash through that Kumo twist on August 29 if $4,238 support doesn’t hold.
Trade Bitcoin now with 100x leverage!
The below chart is an update from this chart.


