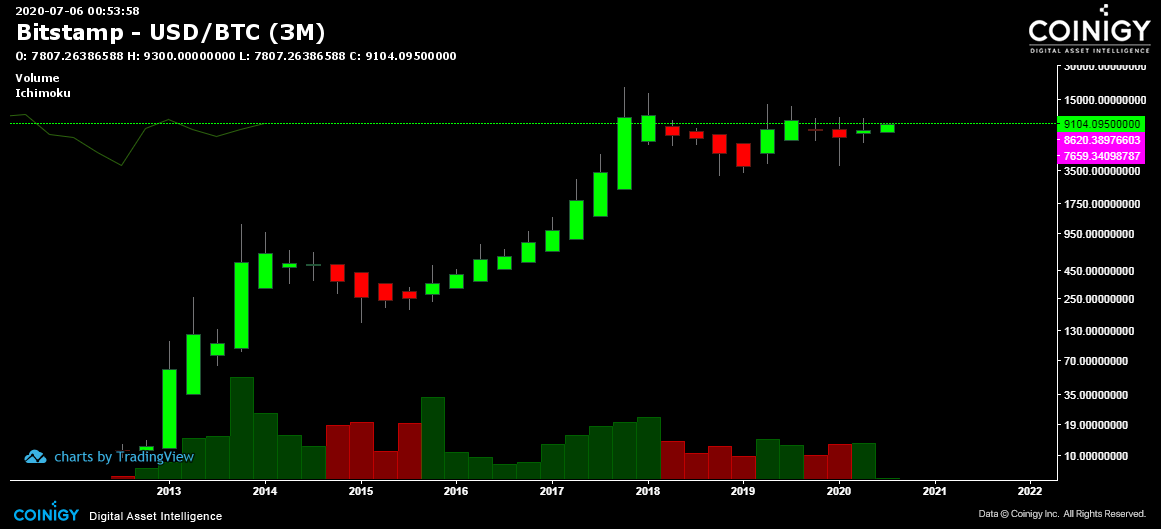
Where is this going? Three-month Heiken Ashi Bitcoin charts
If you look at the three-month charts of Bitcoin in heiken ashi, you would say it is looking bullish. What are the odds that the July-September candle becomes red in the following three months. To me it looks like only two consecutive red or green candles are not typical. For me, the only reason the last red candle became red because of the Covid-19 pandemic. If there were no pandemic, it would have been more smoother green candles all the way.
What do you think? Current candle can still reverse and change color?
By the way, are you interested in free social trading for bitcoin?


