The Story of Bitcoin’s 3-Day Chart 50MA/200MA
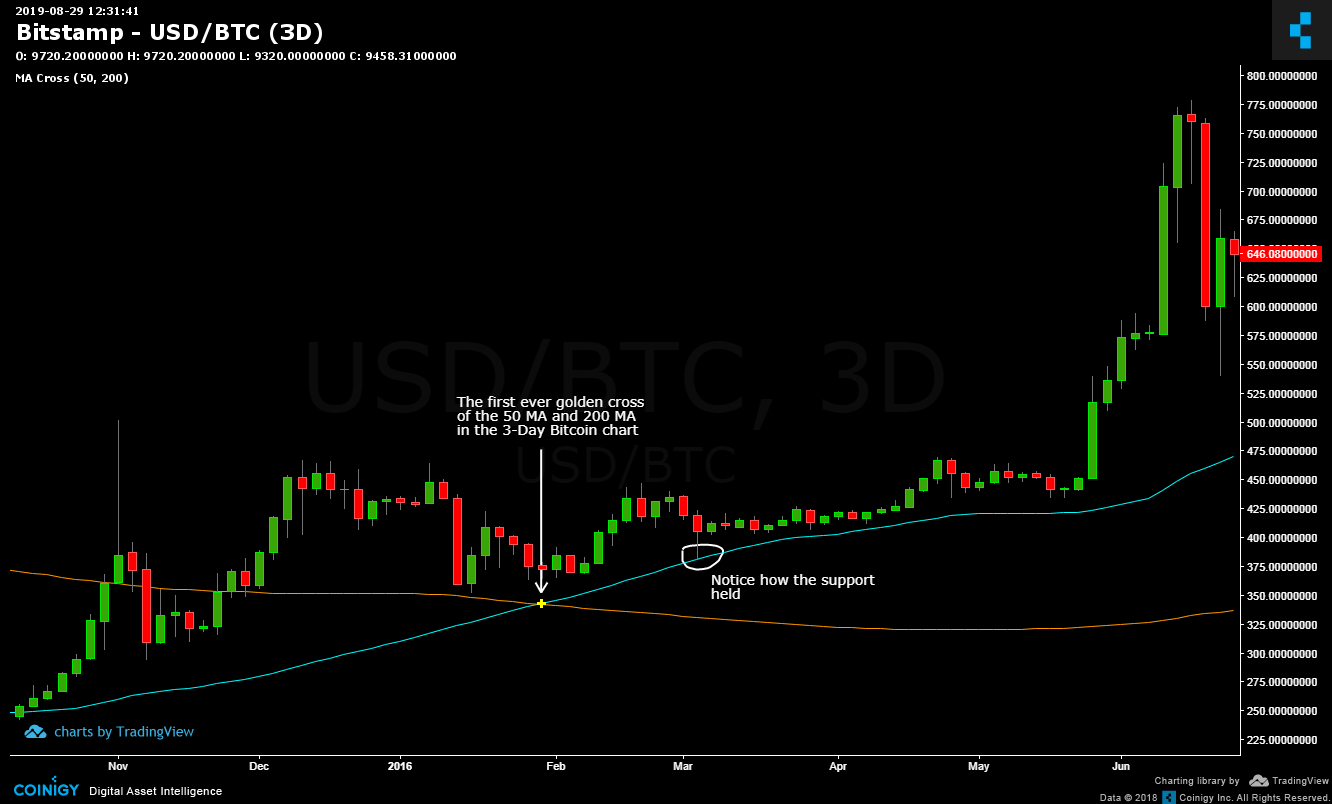
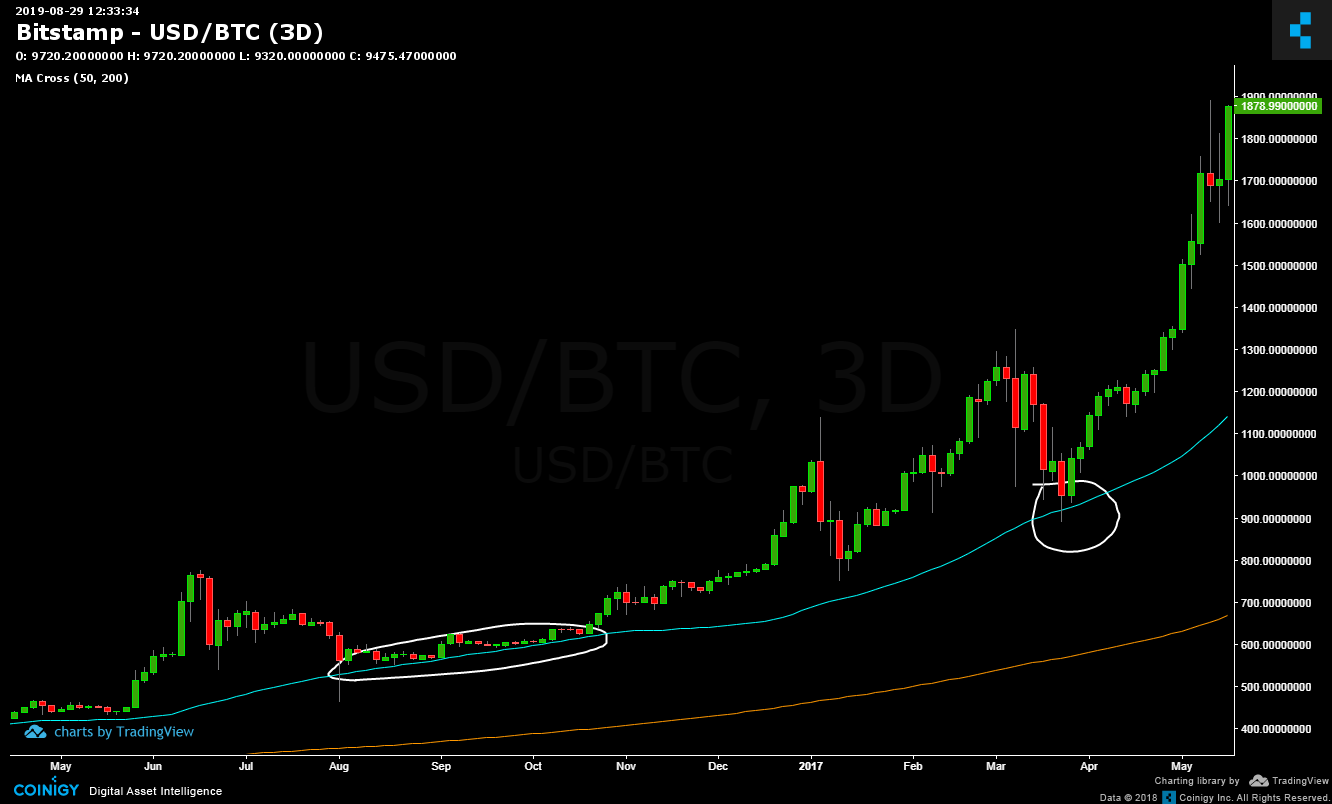
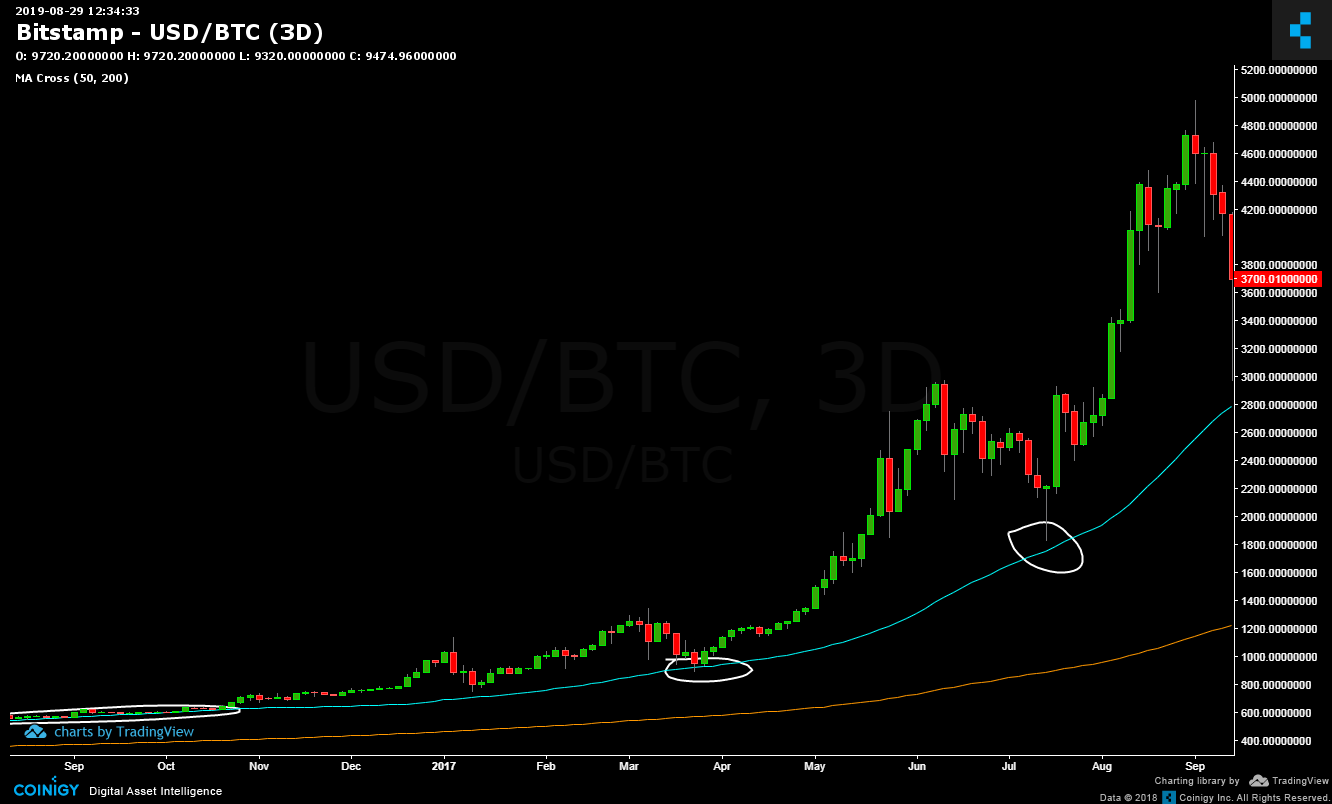
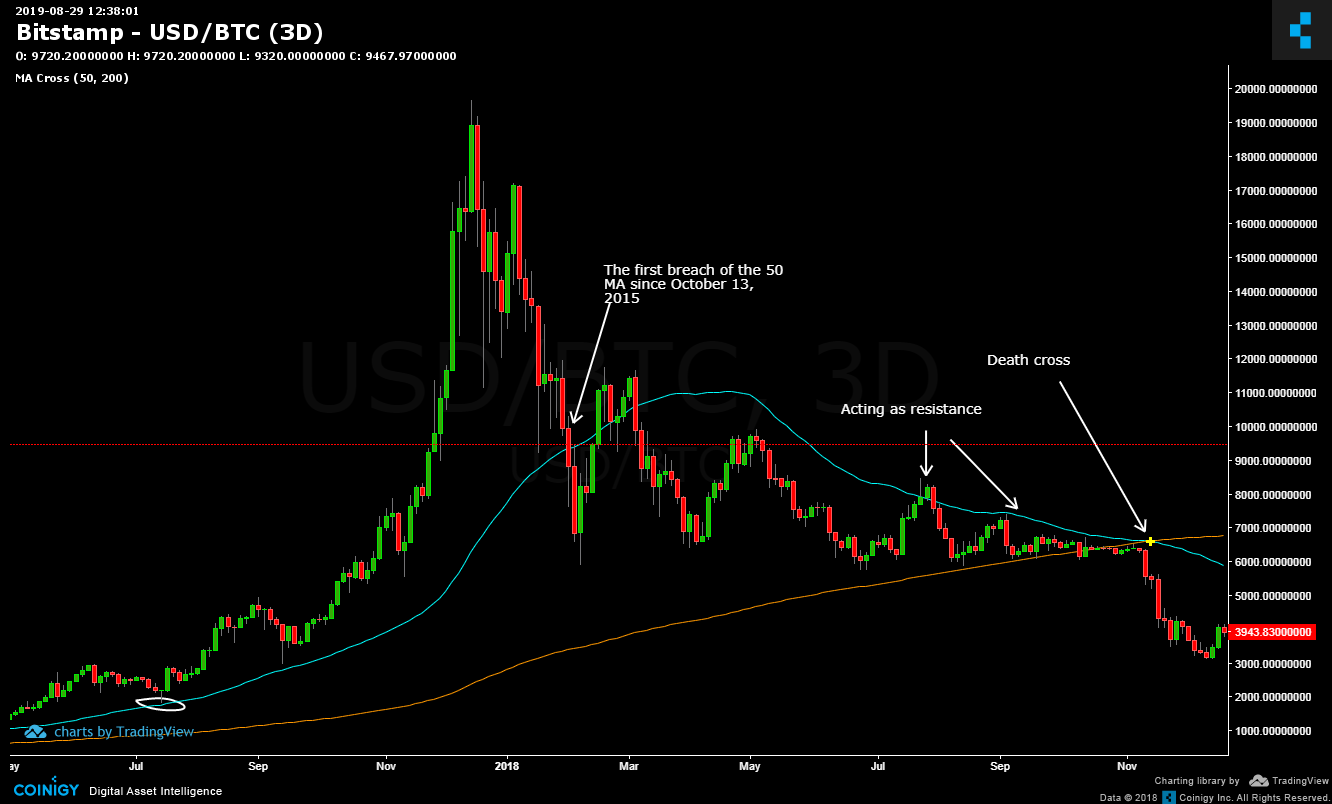
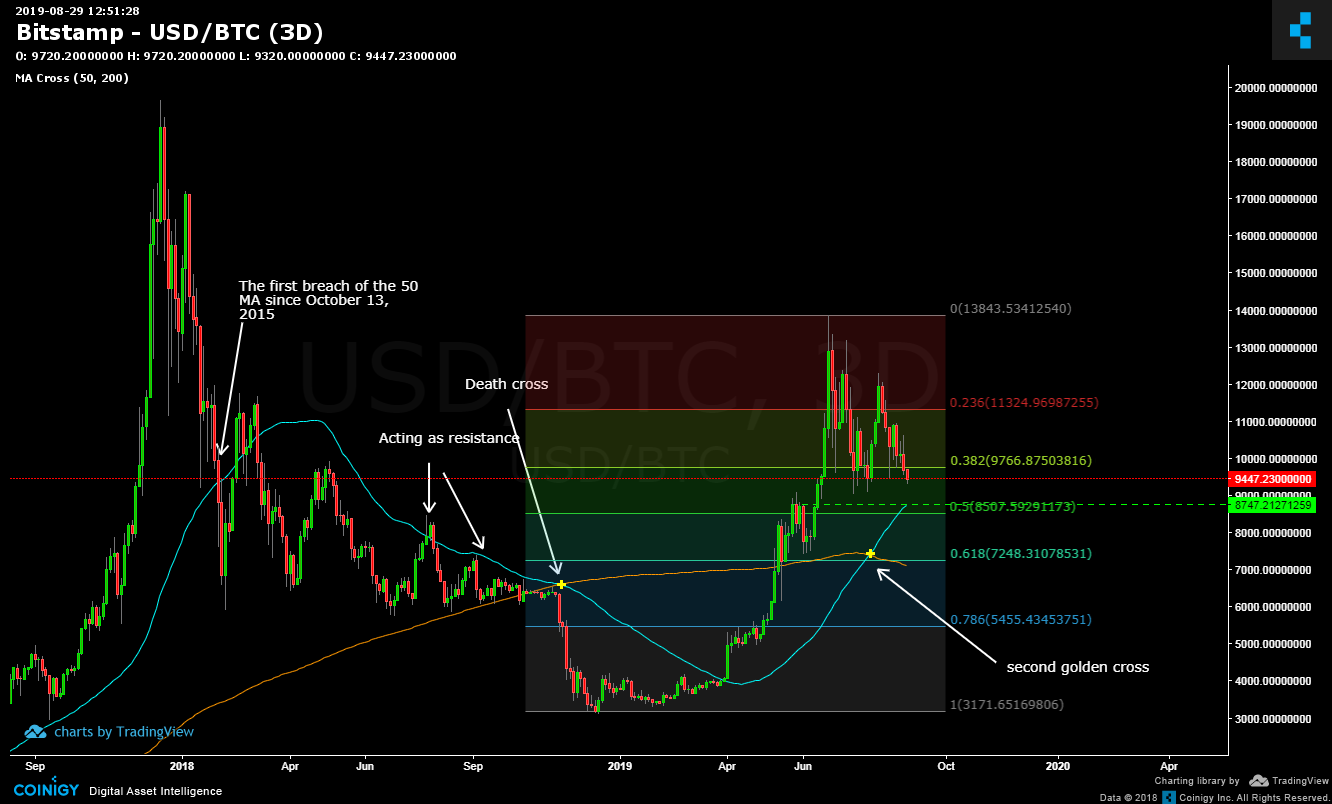
Bitcoin’s first golden cross of the 50 Moving Average and 200 Moving Average in its 3-day chart history was on January 31, 2016. The 50MA remain above the 200MA two years, nine months and 15 days until the second death cross on November 15, 2018.
The second golden cross occurred last July 30, 2019.
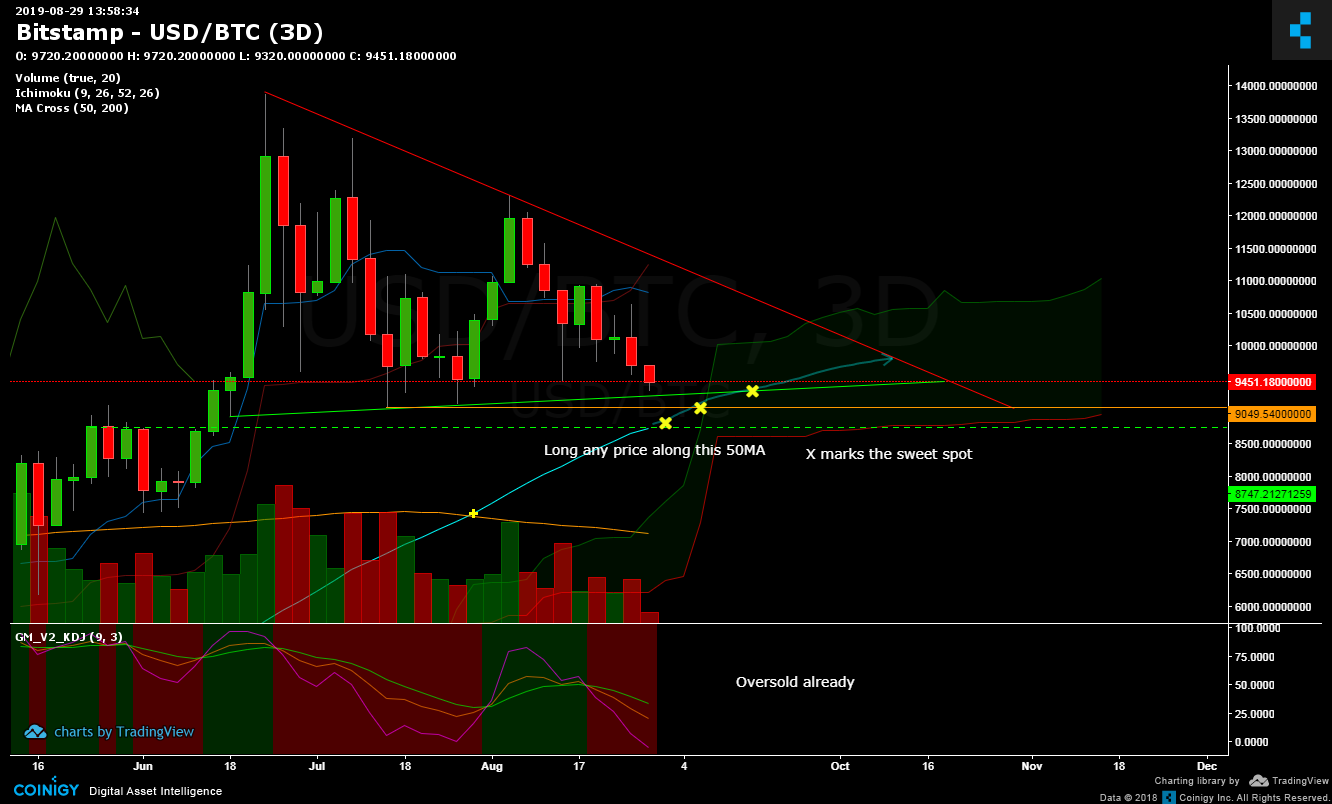
As Bitcoin price is crashing, I believe the 50MA currently at $8,747 will act as a strong support price. Since the 50MA was never tested after the recent golden cross, I am convinced by some analysts it could still be tested.
So, I will place long positions along this 50MA line. Besides the J Line of the KDJ indicator say it is in oversold territory.
Do you know what social trading is?

